SUMMARY: We are looking at options trades to position for a hawkish payroll report. We are not making a call that payrolls will be firm (hiring IS slowing) or that the urate will move lower. Today’s report focuses on data that suggests a lower unemployment rate is increasingly POSSIBLE. Risk assets are not yet priced for that increased possibility.
European government bond yields moved sharply higher following ECB president Lagarde’s more hawkish than expected comments yesterday. The U.S.-Japan trade deal is increasing speculation that the BOJ will raise short-term rates later this year.
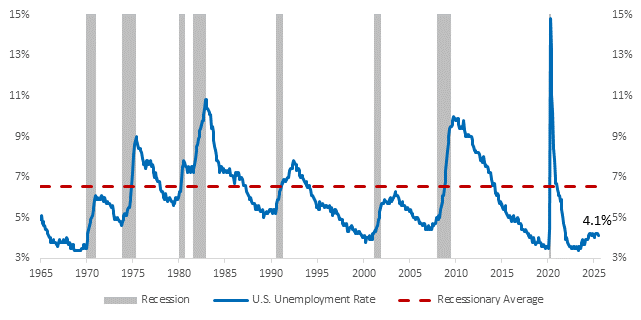
The tone is changing globally on cuts. In the US, given how little hiring is needed to keep the unemployment rate flat (~50k a month estimated), it is possible, not necessarily probable, that the unemployment rate (currently 4.1%) prints at or below 4% next Friday. Only 3% of our survey respondents expected the unemployment rate would decline last month (survey results HERE). In recent conversations with clients, the focused remains more on upside vs. downside risks to unemployment. Bottom line – The shrinking labor supply issue is underappreciated. If a 4% or lower unemployment rate occurs, it would have a significant impact on UST yields and market internals – interest rate sensitivities suffer.
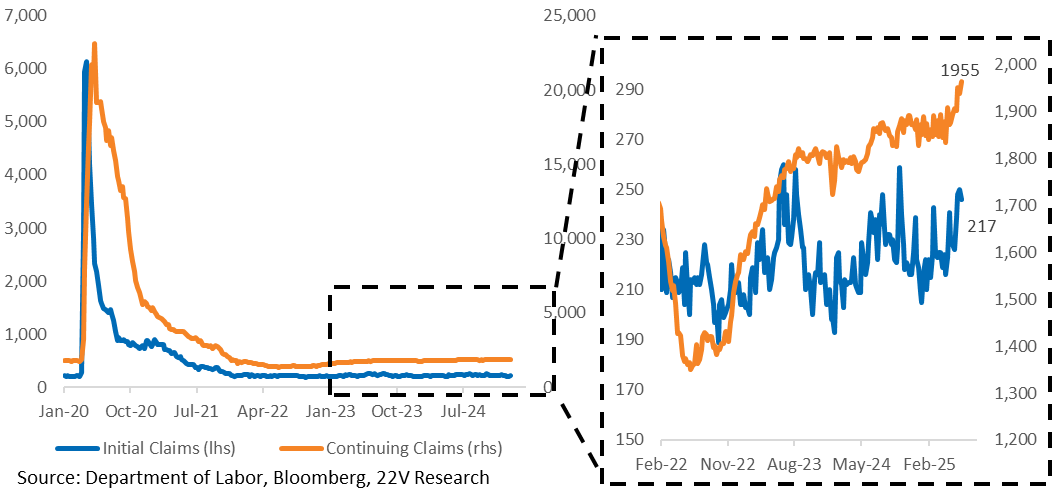
FYI – Unemployment claims moved down to 217K yesterday, and the 3-month change in S&P PMI services employment ticked higher. The headline service S&P PMI increased to 55 vs. 53 as expected. That is a large beat and high in level terms. With services accounting for ~70% of US GDP and, by extension, most US jobs, the odds of a significant urate increase are lower.
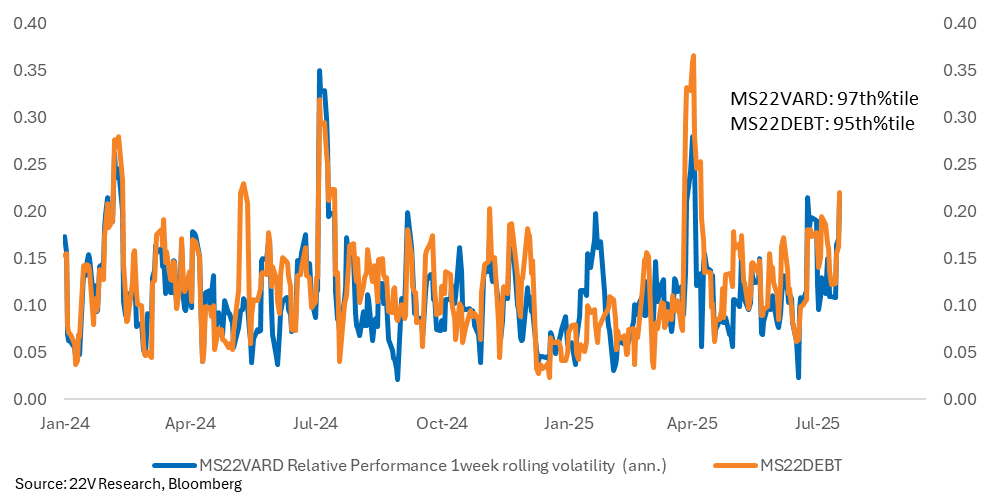
Risk-On Factor Vol and Specifically Debt Risk Volatility – We are on the sidelines with risk-on trades and have made a point to avoid shorting risk-on factors as well. We have noted that the vol in risk factors is likely to be high, and that is playing out. One-week rolling volatility (annualized) in our Debt Risk basket has surged to the 95th %tile, while Variable Debt volatility has reached the 97th %tile. In this environment, the focus should not be on risk factor exposure. Instead, investors should pivot toward earnings and idio as the primary drivers of performance.
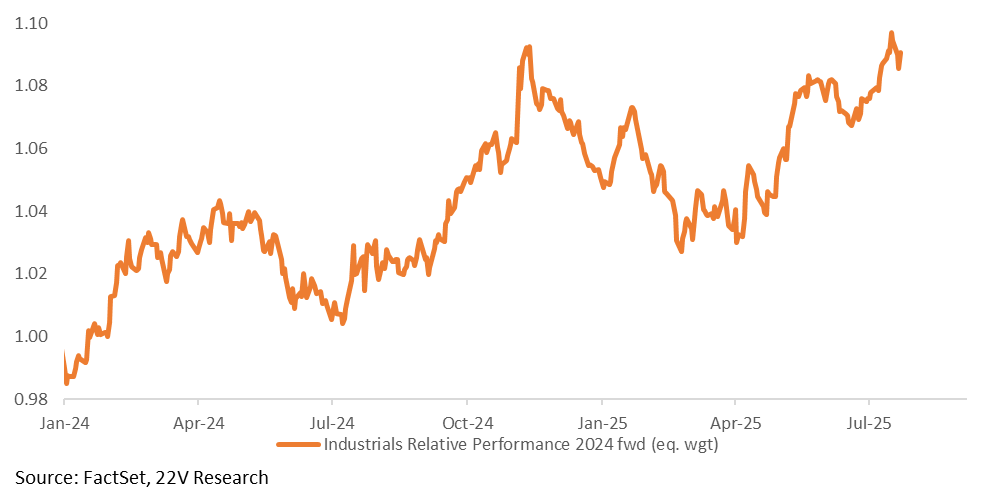
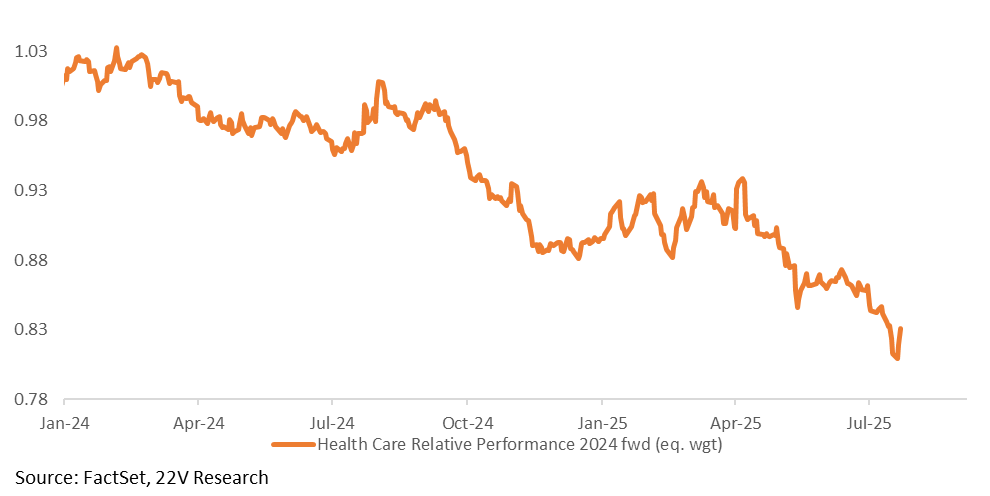
We had 22V Technical Analyst John Roque review the equally weighted sector relative performance charts. We like looking at the equally relative performance of sectors to get a better sense of the breadth of returns in each sector. Sectors John currently sees in an uptrend are Industrials, Utilities, Financials, and Communication Services. The sectors John is bearish on are Energy, Health Care, and Real Estate.
Full report below…
MARKET VIEWS: Data yesterday were consistent with trends over the past few years. A low firing backdrop (claims back down to 217k) and a relatively weak manufacturing sector. Claims data reduce upside risk to the unemployment rate. A flat unemployment rate (currently 4.1%) and the continued short-term tariff-induced inflationary impulse increase the odds that the Fed will be slow to cut. FYI – the Fed might cut in September even if the data is mildly hawkish, but lower recession risk and a low urate would likely remove implied cuts from the Fed funds futures curve. If the Fed funds futures curve shifted higher, financial conditions would be biased to tighten somewhat.
The services PMI was stronger than expected and high in level terms (55.2 vs. 53.0 est.). With services accounting for ~70% of US GDP and, by extension, most US jobs, the odds that the unemployment rate increases significantly have declined. FYI – The 3-month avg change in services employment ticked higher. Manufacturing employment continued to expand, albeit at a modest pace. Bottom line – given how little hiring is needed to keep the unemployment rate flat, it is possible (not necessarily probable) that the unemployment rate (currently 4.1%) prints at or below 4.0% next Friday. That would have a big impact on UST yields and market internals – interest rate sensitives suffer – if it were to happen.
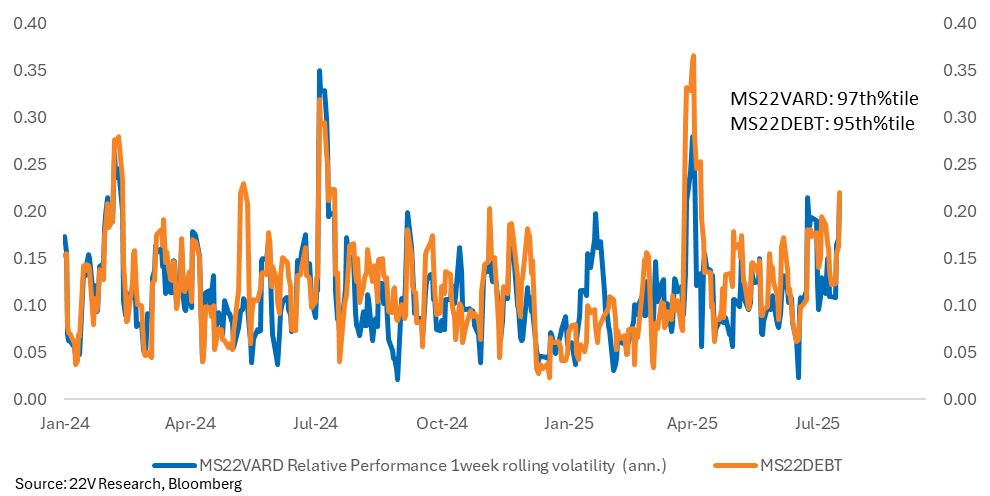
DEBT BASKETS VOLATILITY: We are on the sidelines with risk-on trades and have made a point that we would not be short the risk-on factors either. We have noted that the vol in risk factors is likely to be high and that is playing out. Using the 22V Debt risk baskets as an example, the relative performance of our debt risk basket (MS22DEBT Index) was up 1.1% Wednesday, then down -1.6% yesterday, and our variable debt basket (MS22VARD Index on bbg) was up 0.9% on Wednesday and down -1.6% yesterday.
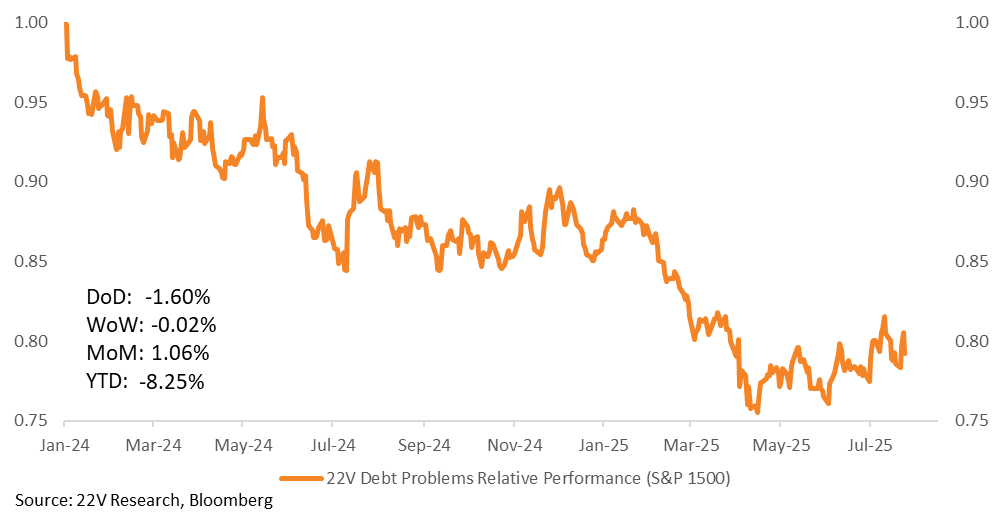
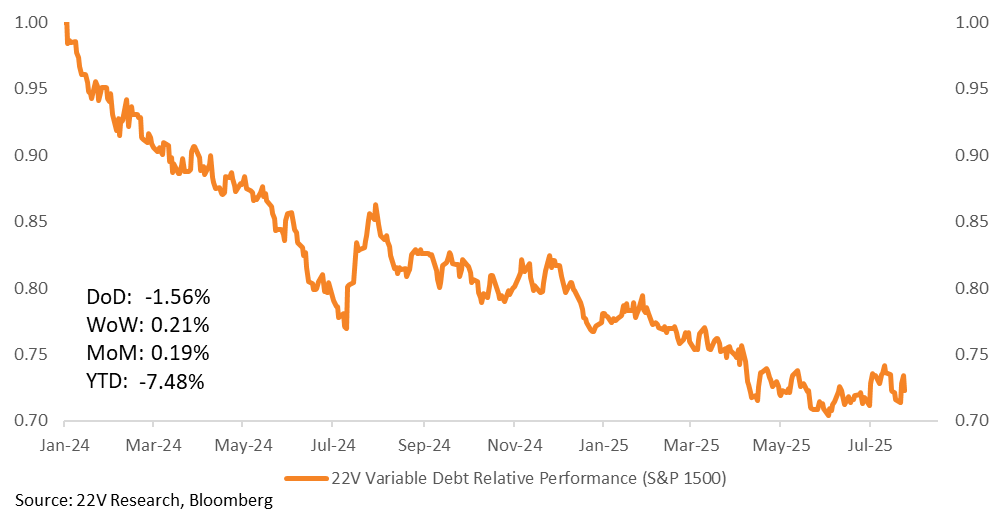
One-week rolling volatility (annualized) in our Debt Risk basket has surged to its 95th%tile, while Variable Debt volatility has reached the 97th%tile. In this environment, risk factor exposure should not be the focus. Instead, investors should pivot toward earnings and idio as the primary drivers of performance.
S&P SECTOR TECHNICAL SCORES: 22V’s Technical Analyst, John Roque, scored S&P 500 Sectors (Equally Weighted) relative performance charts to the S&P. Below are all the charts and John’s commentary on them, starting with sectors in an uptrend and ending with the sectors John is bearish on…
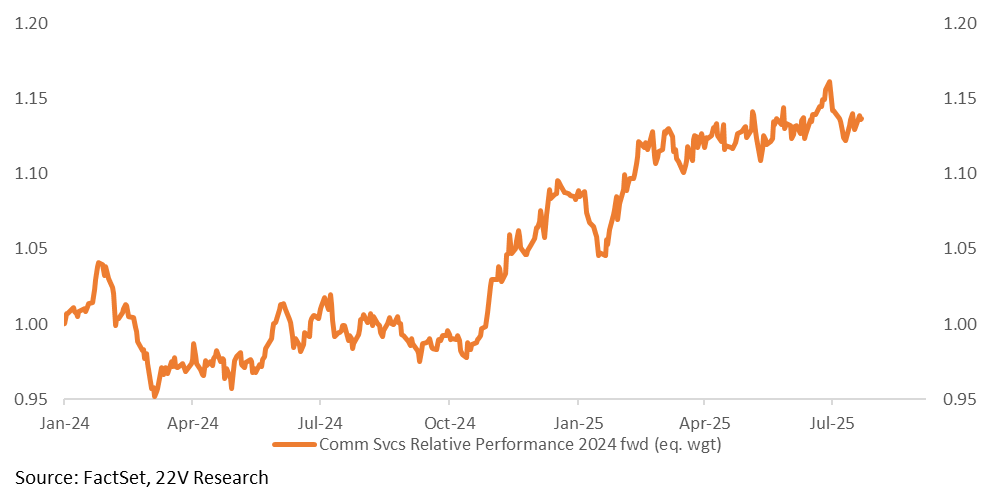
…Communication Services vs. the S&P 500 is still in an uptrend. We’ll give it the benefit of the doubt until/unless it moves beneath its spring 2025 low.
Industrials are still a leader relative to the S&P 500.
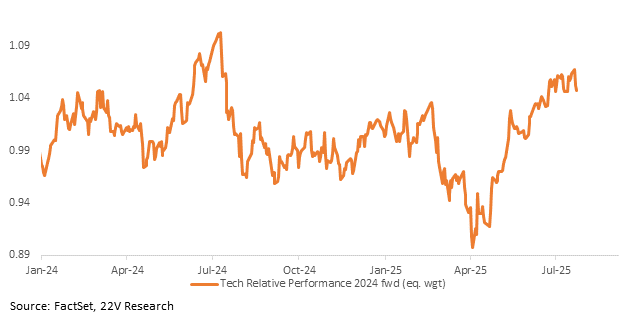
Tech relative to the S&P is retesting its 2024 highs. This might be the spot where Tech underperforms or at least rests vs. the S&P 500. The rally off the April 2025 low has been brash and powerful, but even Usain Bolt rests once in a while.
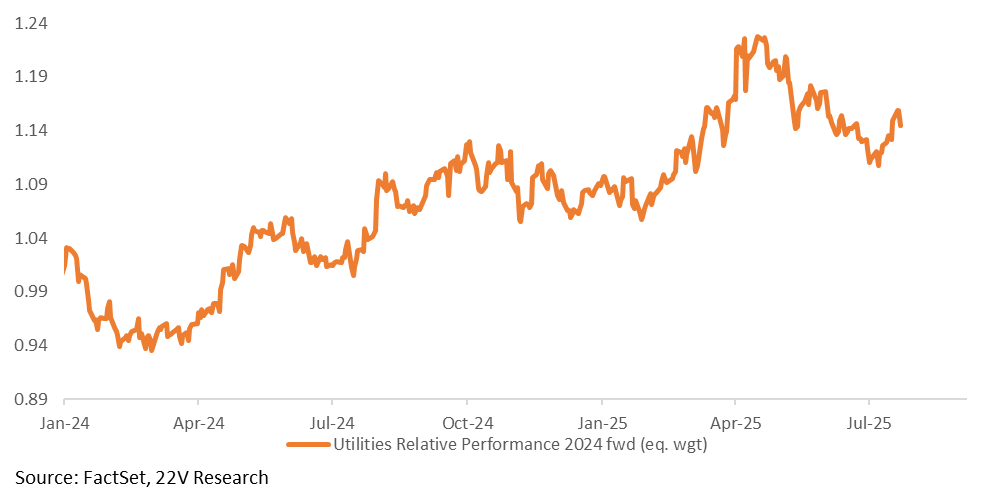
Utilities are in an uptrend in force since the early 2024 lows. The sector gets the benefit of every doubt from the long side.
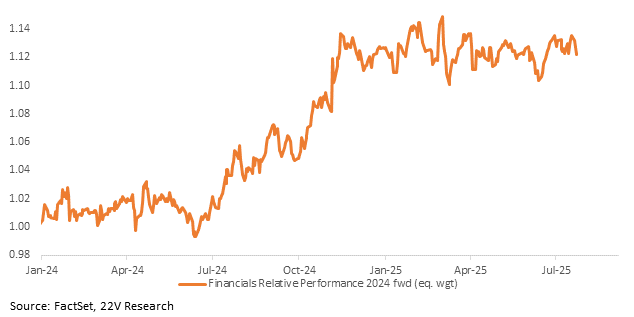
Financials have been sideways since autumn 2024 but still gets the benefit of the doubt from the long side. No cause for concern unless it breaks below the 2025 lows.
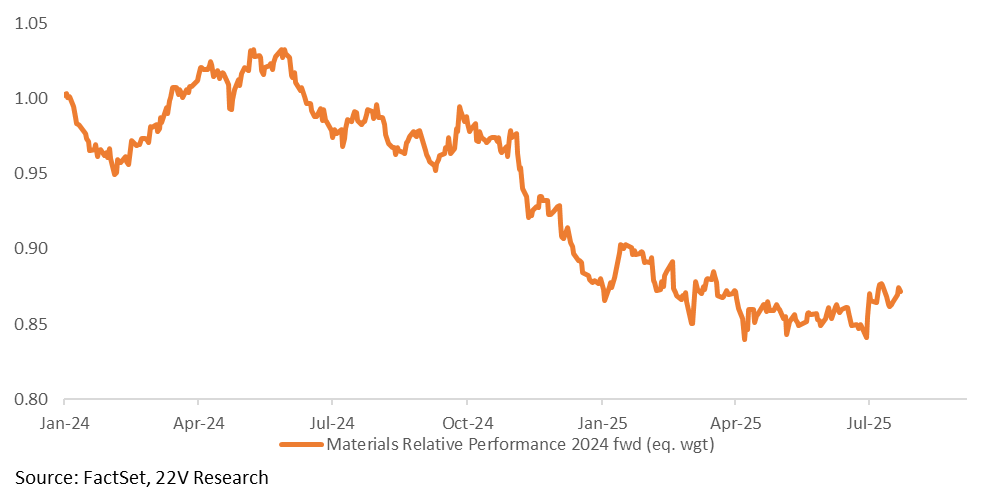
Good semblance of a turn here for Materials relative to the S&P 500.
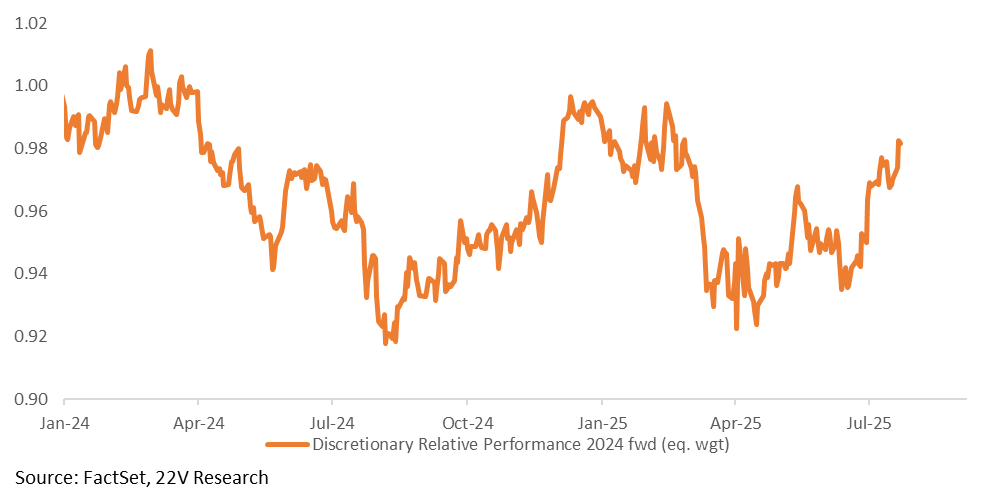
Relative price for Discretionary vs. the S&P 500 is the same as spring 2024. This sector has moved sideways for more than a year.
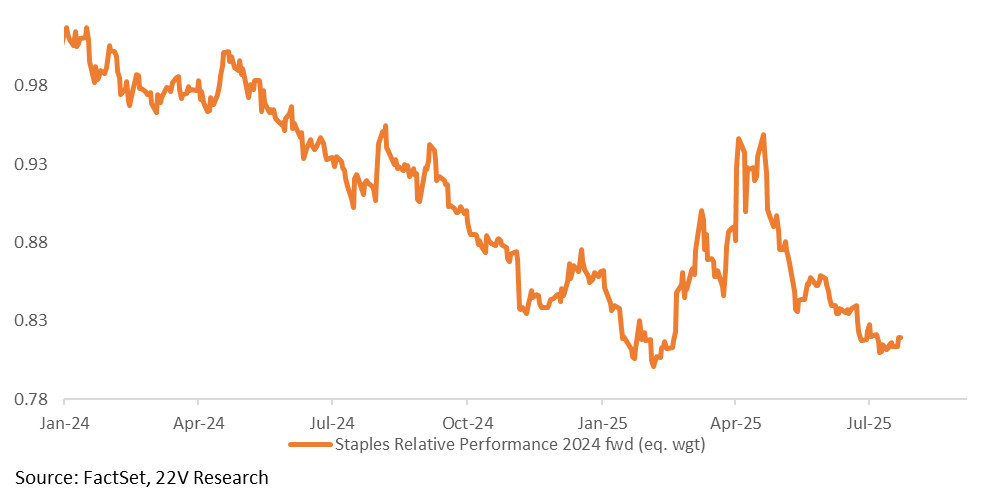
We might make the case here for a double bottom for Staples vs. the S&P 500 as the ratio retests the early 2025 low.
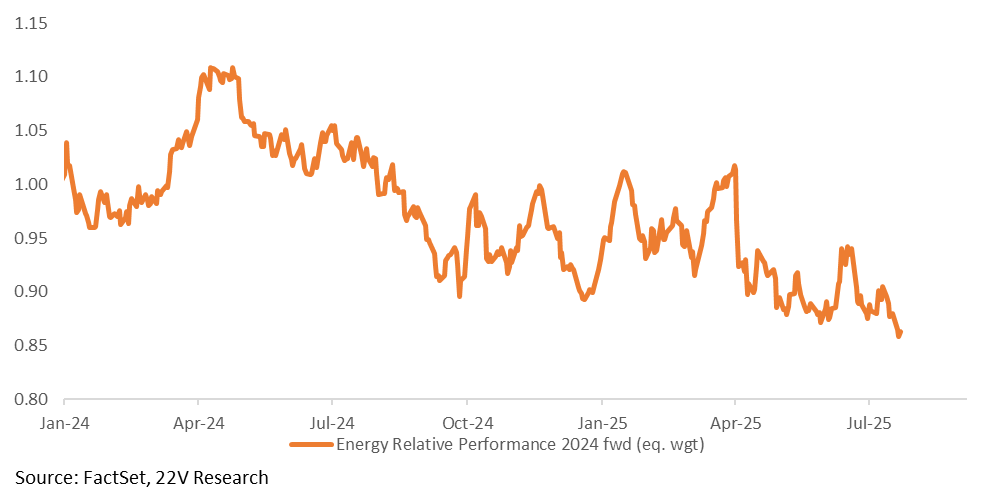
Relative performance for Energy vs. the S&P remains in a downtrend. There are easier ways to get gray hair than trying to guess when the bearish relative price trend for Energy will turn.
Bearish downtrend for Health Care vs. the S&P 500 is still in force. Energy and Health Care have the poorest relative price trends.
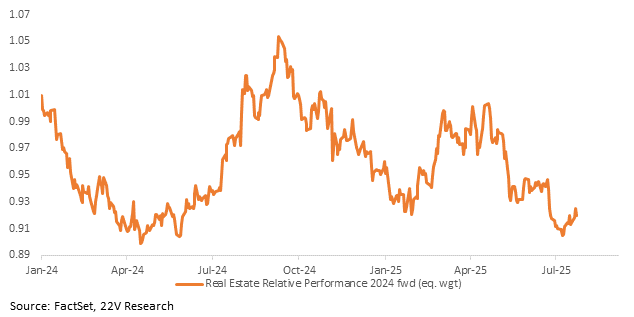
Real Estate is still bearish relative to the S&P 500, though not as bad as Energy or Health Care.