Back Economics

Lower net external debt in Q1 AND it is not all better

Published on June 30, 2025

Download the PDF Report

By

Gerard MacDonell

BEA’s data on America’s net international investment position (or external debt less formally) are slow moving and therefore never newsworthy. However, this morning’s update through the first quarter of 2025 present an occasion to update a story I have been following. 

The gist of the story is that the large current account deficit confirms what the currency chart would itself suggest, that the US dollar has been – and remains – somewhat elevated. And relatedly, the accumulation of large current account deficits over the past few years has pushed America’s net debt up to a level that suggests that portfolio balance effects should increasingly weigh on the relative price of dollar-denominated assets.  Most of the rebalancing here is likely to come through the dollar, rather than domestic financial asset prices, primarily because the US is a large and (relatively) closed economy, compared with, say, Canada, where domestic asset prices would have to move more to accommodate / offset the (larger) macro effects of a weaker currency.  

It would be great to quantify this issue, but that is not typically my strength. My attempt at a value add here is to point out that the backdrop has evolved over the past couple to few years with implications that would be obvious, qualitatively.

An image of US risk off during the first quarter
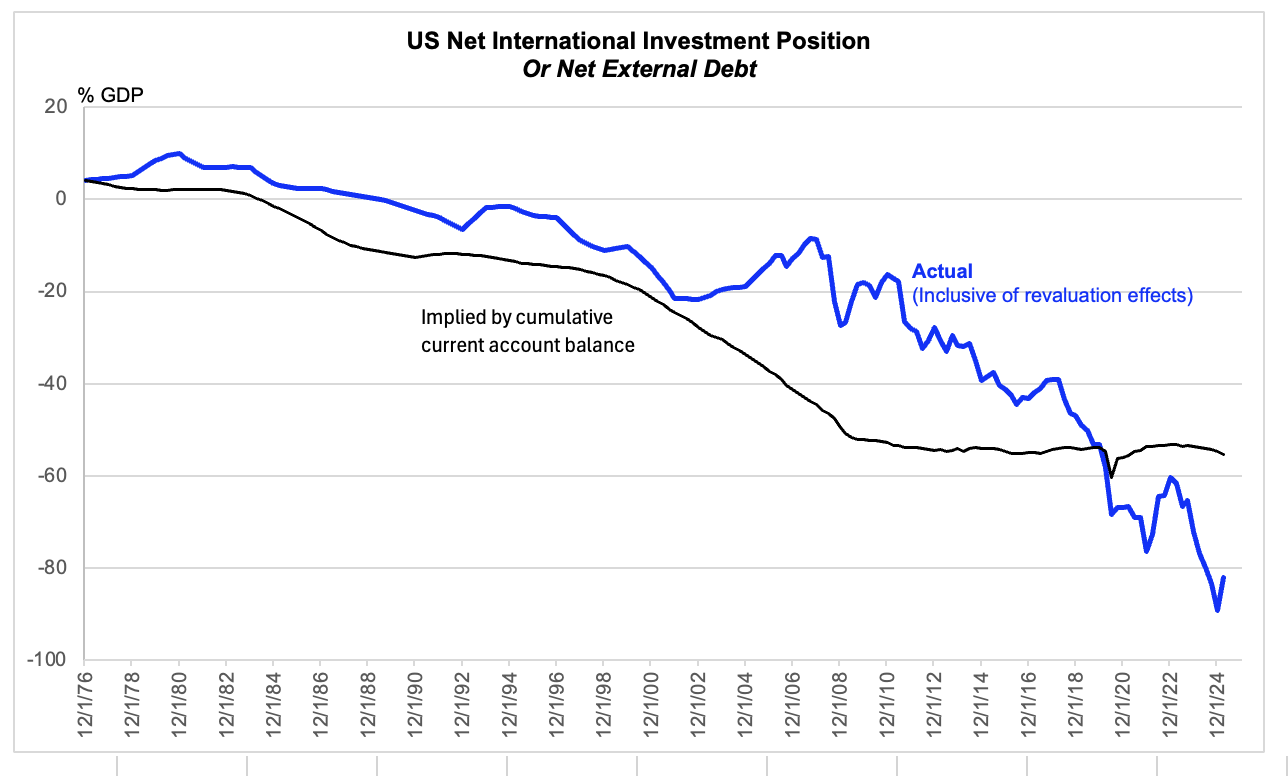
Source: BEA, FH calculations
Data are actual to Q1.

Starting with the headline, the net external debt fell – unsurprisingly – from 89% of GDP during Q4 2024 to 82% in Q1 2025, primarily due to revaluation effects that I will discuss immediately below.  But when thinking about how the external accounts relate to pressure on asset prices, it is probably best to start with a thought experiment in which revaluation effects are assumed to be neutral and we trace out the path of the net debt under various scenarios for the current account balance. Assuming that the current account balance stabilizes at about 5% of GDP and that nominal GDP growth runs at a trend of 4%, the net external debt would approach 125% of GDP along a tangent.  Because 125% is probably too large (again a qualitative assertion), we should expect asset prices to move in a way that would ward off that result, via both revaluation effects in asset markets and competitive realignments in goods and services markets that would incline the net export deficit (and therefore the current account balance) to improve.  Within this template, the key point is that the net external deficit is large and inclined to rise further. If it fails to rise because of revaluation effects, then my call here would have been correct.

The market value of external liabilities fell
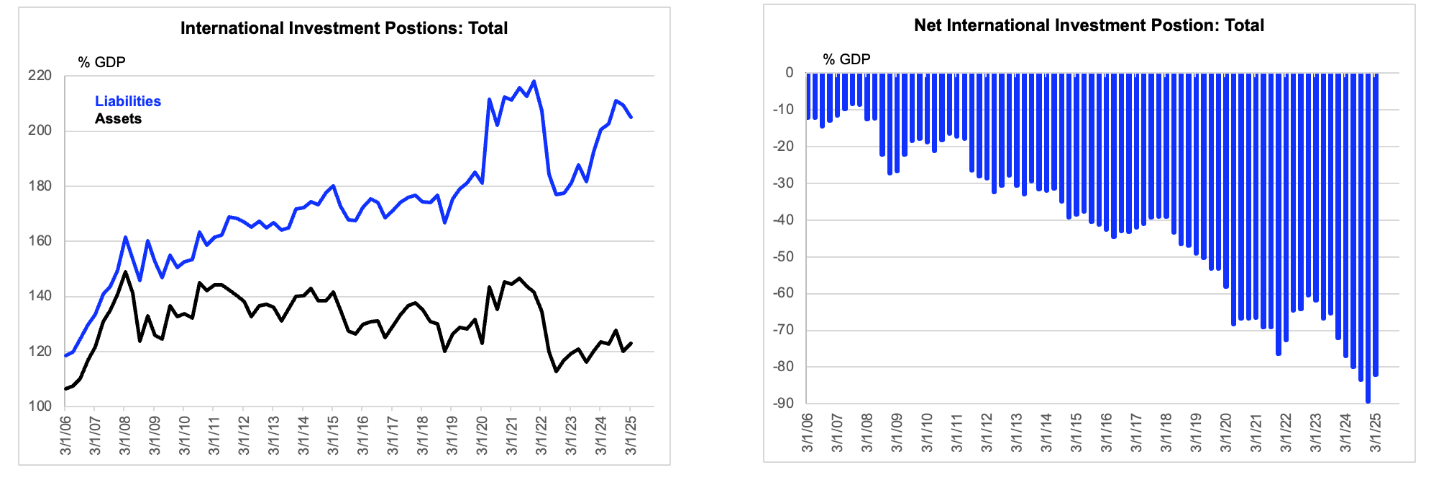
Source: BEA, FH calculations
Data are actual to Q1.

During the first quarter, the main cause of the decline in the net external debt was the drop in the market value of US liabilities, associated with the recent – and recently reversed – risk off in US markets.  The market value of US assets somehow managed to eke out a small gain, but that seems to have been due more to developments in overseas asset markets than to the translation effects of the dollar itself, as its recent weakness has been mostly concentrated in the second quarter.  And as an aside I should mention that it might not dominate, because US equities have gone up more than the dollar has gone down.   

We can separate the external debt into equity related (including FDI) and non-equity related, which is heavily denominated by debt. In fact, what the BEA calls non-debt items seems to me to be best considered as debt anyway.  As you can see from the chart above, the market value of equity-related external liabilities fell during the first quarter, even though there have been net external flows into this asset class over the past few quarters, as I documented in my note last week. So, here we see the straightforward effect of risk off, which the dollar asset bull does not get to extrapolate for obvious reasons. He would be right by being wrong on the more practical issue!

Mostly in equity related
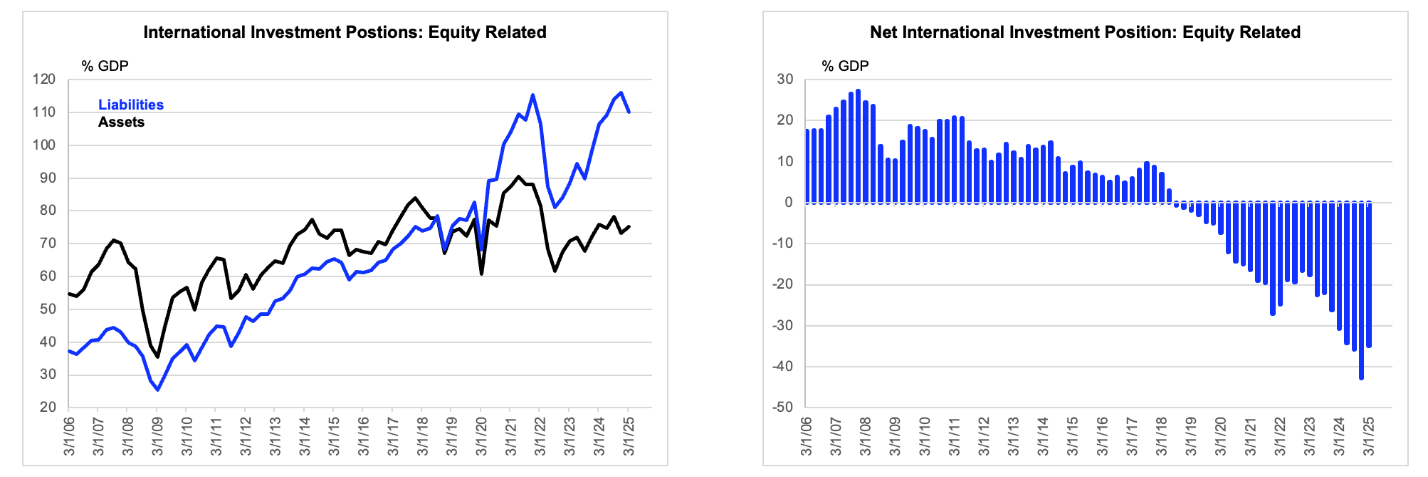
Source: BEA, FH calculations
Data are actual to Q1.

And the non-equity related external debt figures moved by much less, because fixed income valuations are less volatile and because – as mentioned – the dollar was not particularly weak during the first quarter. There will be some slippage between the trade weighted dollar that I monitor and the external asset weighted dollar that you might imagine. But you get my point. 

Not much going on elsewhere
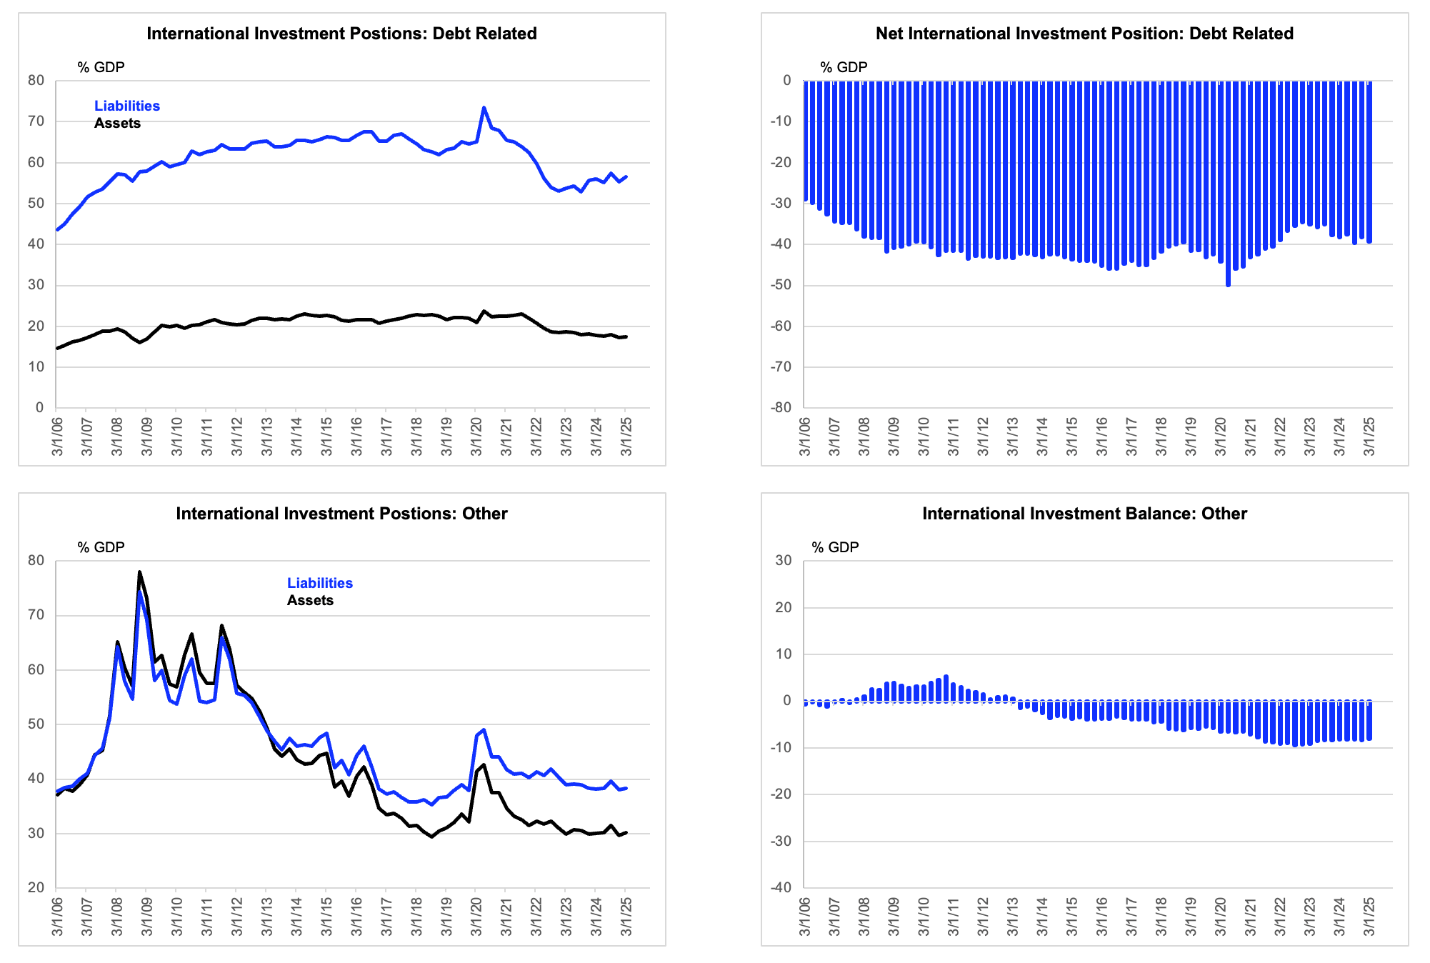
Source: BEA, FH calculations
Data are actual to Q1. Note that vertical scales are set to allow easy comparison of relative importance of revaluation effects. 

DISCLOSURES AND DISCLAIMERS

Analyst Certification

The analyst, 22V Research Group, primarily responsible for the preparation of this research report attests to the following: (1) that the views and opinions rendered in this research report reflect his or her personal views about the subject companies or issuers; and (2) that no part of the research analyst’s compensation was, is, or will be directly related to the specific recommendations or views in this research report.

Analyst Certifications and Independence of Research.

Each of the 22V Research analysts whose names appear on the front page of this report hereby certify that all the views expressed in this Report accurately reflect our personal views about any and all of the subject securities or issuers and that no part of our compensation was, is, or will be, directly or indirectly, related to the specific recommendations or views of in this Report.

22V Research (the “Company”) is an independent research provider. The Company is not a member of the FINRA or the SIPC and is not a registered broker dealer or investment adviser. 22V Research has no other regulated or unregulated business activities which conflict with its provision of independent research.

22V Research, LLC is a professional services and independent publication organization. 22V Research, LLC is not a securities broker-dealer, not a member of the Financial Industry Regulatory Authority (FINRA), not a registered investment advisor (RIA) and not a member of SIPC.

Securities transactions, when offered, are offered by 22V Securities, LLC through LPS Capital, LLC. Certain employees of 22V Securities, LLC are dually registered as securities representatives of LPS Capital, LLC or Analyst Hub Securities, LLC. 22V Securities, LPS Capital and Analyst Hub Securities are members FINRA, SIPC.

https://brokercheck.finra.org/

Current Ratings Definition.

SECTOR OUTPERFORM: An “outperform” rating anticipates the company will outperform the S&P Regional Banking Index (peer group).

SECTOR PERFORM: A “market perform” rating anticipates the company will perform in line with the S&P Regional Banking Index (peer group).

SECTOR UNDERPERFORM: An “underperform” rating anticipates the company will underperform the S&P Regional Banking Index (peer group).

Limitation Of Research And Information.

This Report has been prepared for distribution to only qualified institutional or professional clients of 22V Research Group. The contents of this Report represent the views, opinions, and analyses of its authors. The information contained herein does not constitute financial, legal, tax or any other advice. All third-party data presented herein were obtained from publicly available sources which are believed to be reliable; however, the Company makes no warranty, express or implied, concerning the accuracy or completeness of such information. In no event shall the Company be responsible or liable for the correctness of, or update to, any such material or for any damage or lost opportunities resulting from use of this data. Nothing contained in this Report or any distribution by the Company should be construed as any offer to sell, or any solicitation of an offer to buy, any security or investment. Any research or other material received should not be construed as individualized investment advice. Investment decisions should be made as part of an overall portfolio strategy and you should consult with a professional financial advisor, legal and tax advisor prior to making any investment decision. 22V Research Group shall not be liable for any direct or indirect, incidental or consequential loss or damage (including loss of profits, revenue or goodwill) arising from any investment decisions based on information or research obtained from 22V Research Group.

Reproduction And Distribution Strictly Prohibited.

No user of this Report may reproduce, modify, copy, distribute, sell, resell, transmit, transfer, license, assign or publish the Report itself or any information contained therein. Notwithstanding the foregoing, clients with access to working models are permitted to alter or modify the information contained therein, provided that it is solely for such client’s own use. This Report is not intended to be available or distributed for any purpose that would be deemed unlawful or otherwise prohibited by any local, state, national or international laws or regulations or would otherwise subject the Company to registration or regulation of any kind within such jurisdiction.

Copyrights, Trademarks, Intellectual Property.

22V Research Group, and any logos or marks included in this Report are proprietary materials. The use of such terms and logos and marks without the express written consent of 22V Research Group is strictly prohibited. The copyright in the pages or in the screens of the Report, and in the information and material therein, is proprietary material owned by 22V Research Group unless otherwise indicated. The unauthorized use of any material on this Report may violate numerous statutes, regulations and laws, including, but not limited to, copyright, trademark, trade secret or patent laws.
