The burdensome regulatory environment has not only kept many investors on the sidelines in the banks, but it also helped contribute to the share loss to private credit over the last many years. While it remains to be seen how far the regulatory pendulum will swing, for the first time in a long time, it’s not an incremental negative for the banking system. But before venturing too far into the past, let’s tackle the more recent environment and walk through our framework for how we look at the opportunity set for the regional banks.
Current Environment:We’ve thankfully journeyed a long way from ZIRP policy which at times was painful (see March of ’23), but the structurally higher yield curve puts the banking system in a stronger position from a net interest income standpoint IF the yield curve can continue to stay relatively steep. As it pertains to rates, we do take some comfort in the fact that while we wait for more clarity on the path of rates vis a vis tariffs/inflation, core lending spreads for the banks are improving with the passage of time. Lest we forget that the Fed has already cut the Fed Funds rate by 100bps in the back half of last year which helped to ameliorate deposit price competition. CD’s put on a year ago are still rolling down to lower rates while loans and securities are repricing higher.
Even with minimal loan growth and a Fed on hold, the mix shift that is happening is supportive of higher NII’s/NIM – a clear positive.
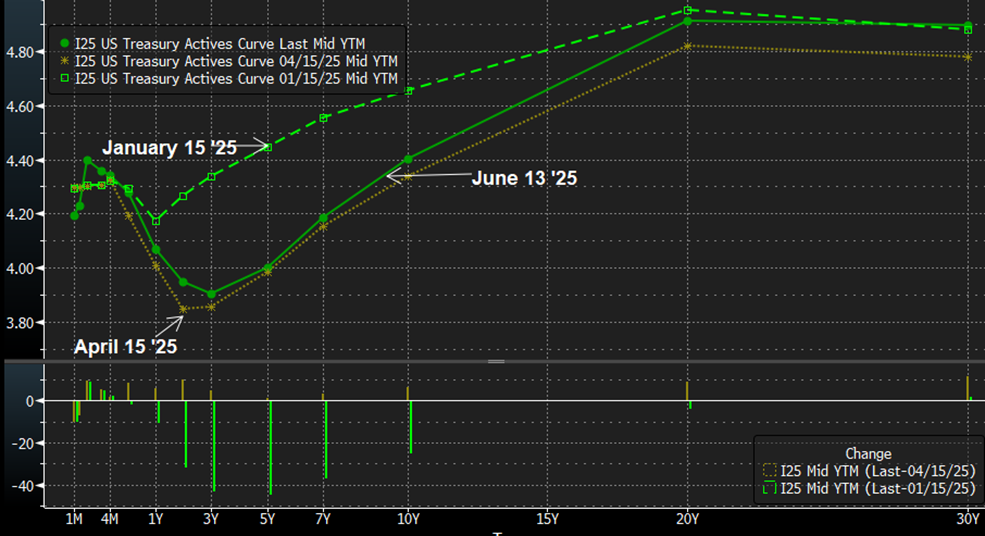
That said, the aftermath of Liberation Day did leave a dent in the rate of change of the front book/back book repricing, but not the positive trend. Best illustrated with a picture, the graphic below shows the yield curve on Jan 15, April 15, and today. Early in the year, investors were rightly bullish on the banks given the steepness of the curve at what was a higher absolute level of rates. Post Liberation Day, the belly of the curve repriced dramatically as you can see below. While loans and securities continue to reprice up from lower levels, the magnitude of reprice this Q has lessened while outlooks on loan growth also came down. The good news is that the worst of the curve hit was being factored in right around 1Q earnings, so the banks in many cases have already had an opportunity to reset the NII bar at the low while reinvestment rates have recouped a bit of that move.
Yield Curve Shape – Jan 15, April 15, & June 13th
Front Book/Back Book Dynamics: In the chart below, we examine some of the front book/back book repricing using regulatory data. We should caveat up front that for our analysis, we took a hypothetical look at what the incremental quarterly contribution would be to net interest margin for both loans and securities assuming a 200bps incremental pickup in reinvestment rates. While it is helpful as a static illustration, each bank is different, each bank is loaning/investing at different points along the yield curve, and it presupposes that loans/securities will mature and will automatically be reinvested which is not always the case. That said, we do think it’s helpful directionally against some of the management commentary.
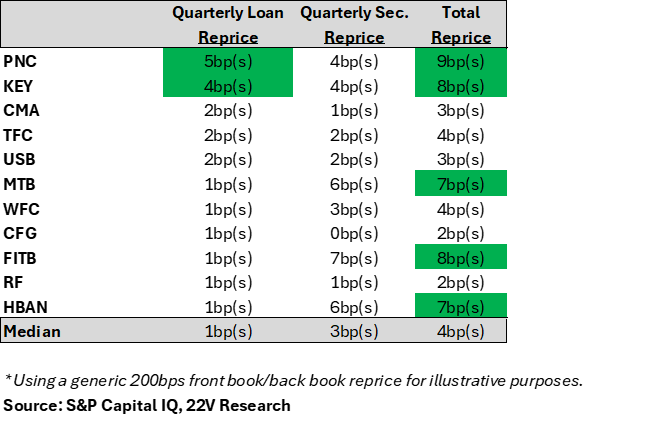
As you can see from the illustration above, PNC & KEY show the greatest level of fixed rate loan reprice and some of the largest overall reprice amongst their large cap peers. In the case of KEY, they actually call out 3bps of NIM benefit of fixed rate asset reprice in their NIM walk in their most recent quarterly earnings slide deck. For PNC, their recent conference commentary also tends to endorse the directionality of this analysis. Bill Demchak noted, “So we’re realizing today the benefits of having stayed both short-duration in terms of total dollars invested and short-duration in terms of the maturity of our fixed-rate assets rolling off. But the point is that the fixed-rate asset repricing continues well into ’26 and ’27. So this repricing is what’s showing up into our income stream. And it’s fairly mechanical, and that continues under the presumption that reinvestment rates stay on or about where they are, which is our expectation.” In short, while these reprice #’s are not hard wired into our models (management’s do offer some guidance on loans maturing in their commentary which we do use), we think it’s a helpful “gut check” to stack rank who potentially has the most relative tailwind in this environment.
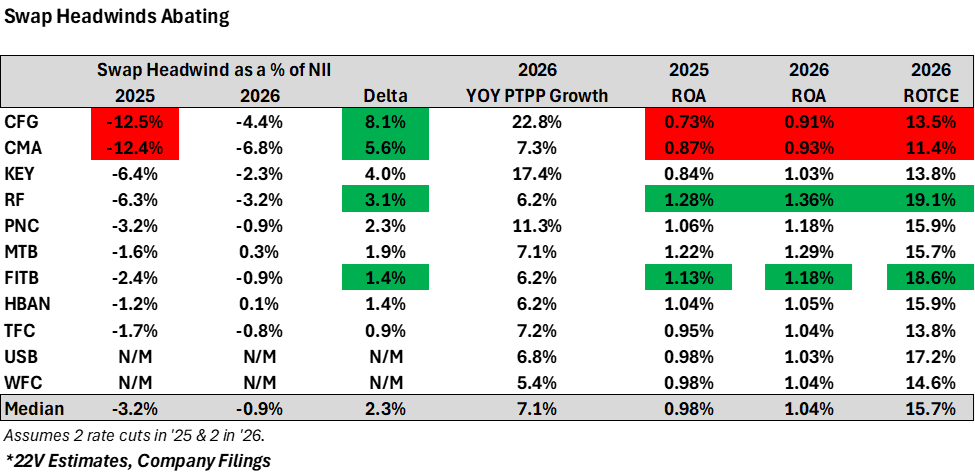
Swap Headwinds Abating: Another drag on recent NII performance has been the headwind from individual swap portfolios. Post years of ZIRP policy and a move up in interest rates, banks understandably wanted to hedge against another decline in interest rates as well as help take their asset sensitive balance sheets to more neutral territory. A spike in inflation post pandemic drove rates higher than many predicted and for a longer period of time. In the table below we take a look at the delta in the degree of NII drag being caused by swaps assuming rate cuts in Sept & Dec of this year and 2 more in ’26. In terms of delta, CFG & CMA lead the list in the potential rate of change. We try to look at each bank situationally rather than simply say “the bigger the positive delta, the better.” One can make the argument that given the business transformation that CFG was embarking on with the First Republic Private Wealth business, being more aggressively hedged made sense to minimize risk while that transformation was in process. On the flip side, MTB shows a more benign improvement which we view as a result of them very artfully managing their asset sensitivity to a neutral position right as the rate cycle peaked causing minimal NII drag for shareholders. Should they be penalized for not being a “relative swap winner” compared to peers? We clearly don’t believe so, especially as you compare their profitability metrics relative to peers. We tend to believe that the degree that you managed the turn successfully accrues to the forward multiple one would pay for the stocks. To that end, we’re favoring RF & FITB who both benefit from the swap reprice and who’s return profile can justify the better valuation. CFG & CMA are out on the bleeding edge with some of the highest leverage to swap improvement. That said, we’re not there on the valuation relative to the return profile for CMA even though we are ahead of consensus on a PTPP basis. For CFG, we see more valuation upside but believe their guidance remains too high for the quarter/remainder of the year which keeps us on the sidelines.
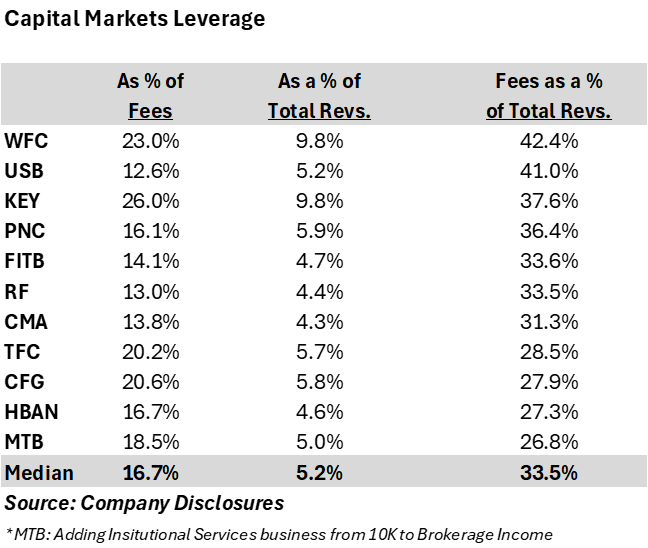
Fee income resiliency: In the chart below, we take a look at fee income both relative to total revenue and we also attempted to isolate out the capital markets contribution given how topical it’s been relative to the tariff concerns of late. While our Fifth Third and Regions picks split the uprights on median contribution to overall revenues, they do index a bit light relative to peers on capital markets revenue. From our vantage point, that’s fine for now given that we’ve seen a few banks begin to walk back some of their fee guidance. In fact, Fifth Third lowered the bar very quickly post 1Q earnings given the new environment rather than waiting and Regions has also been guiding to the low end of their quarterly $80-$90mm quarterly run rate post 1Q. We think keeping expectations realistic will accrue to both if they do happen to see any pickup. A hold up in M&A activity across the board has been a culprit in the fee uncertainty for many in that business. While backlogs continue to build, it remains to be seen if the logjam will be broken near term. We think a balanced approach for now w/FITB & RF makes sense with the optionality of improvement from realistic guides.
Credit – Does it deteriorate from here? Post Liberation Day, the impact of tariffs on small businesses and consumers remains a wild card. The 22V house view is that while we will see a slowdown in GDP, the worst of the potential revisions (flat/negative GDP) is unlikely to be realized. We currently see GDP in the 0.75%-1.5% zone for ’25 before picking back up again in ’26. The stocks have clearly rebounded from the depths of April but appear to have recently stalled out given less attractive relative valuations, upcoming earnings and a wait and see approach on loan growth and credit. We take some solace in the fact that for the past few years, loan growth has been undershooting GDP growth. We realize that’s partially due to the rundown of some of CRE for most of the group and continued inroads from private credit. That said, it tends to be rare to see substantial credit hiccups without either very rapid growth in an asset class or some type of exogenous shock.
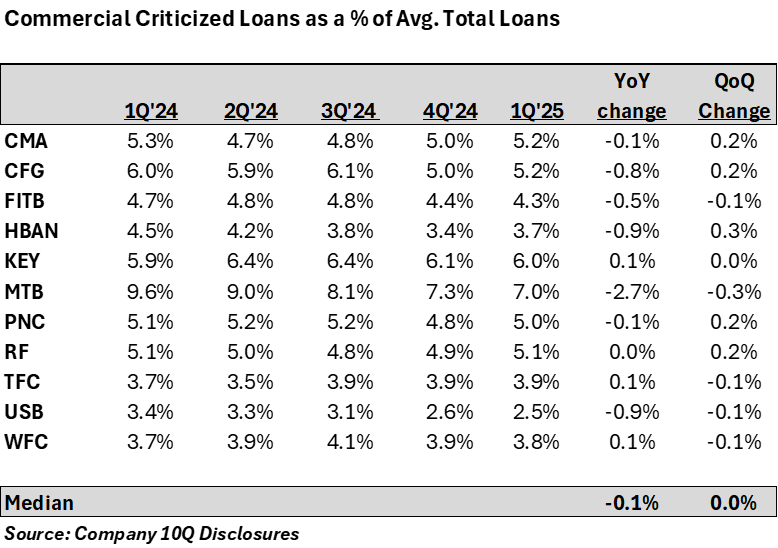
Clearly the pandemic sent an exogenous shock through the office CRE landscape, but while charge-offs/cumulative losses are not insignificant in that asset class, the banking system has plowed through thanks to solid PTPP earnings and good capital. The tariffs clearly count as another potential exogenous shock, but businesses proved to be resilient during Covid and we feel like they have learned to adapt and shift supply chains. While it’s too early for an all clear, we do take some solace in hearing managements continue to reiterate that credit trends are staying benign. In the “trust but verify” category, we pulled commercial criticized loans quarterly for the group going back to 1Q’24 to see if there was anything alarming that we could discern as a leading indicator to future losses. As you can see below, while there have been a few small moves QoQ, by in large there’s very little here. We’ll continue to monitor as we move through the next few quarters, but if this trend can continue, and our call on call on the economy slowing but not stalling before reaccelerating proves correct, bank stocks could also reaccelerate into ’26 post some sideways chop in the remainder of ’25.
Impact of the new regulatory backdrop – where could this go? We think that there are a number of potential positive knock-on effects here. The first is simply the rate of change of new regulation being positive for the first time in a very long time. That accrues in a number of areas. First, the fee backdrop. Given the effective ending of the CFPB, the incremental pressure on overdraft fees, late fees, etc is finally set to abate. In addition, bank’s calls for more transparency into the stress testing process will likely no longer fall on deaf ears. To that end, banks may have a better chance at optimizing their capital and in some cases (see Treasury Secretary Scott Bessent’s commentary on SLR) seeing a new attitude on risk weights which could free up more balance sheet. As it pertains to regular way bank M&A, there already is a more conciliatory tone coming out of Washington which will likely accrue more to the smid-cap banks going forward, but could also carry through to the large cap regionals – although we don’t foresee anything near term.
Part and parcel with the concept of more tailored capital rules freeing up balance sheet is the potential carry through to better loan growth. While it’s difficult to disaggregate how much loan growth has been foregone based on sub-optimal capital rules, given the now ubiquitous nature of private credit, we think it’s realistic to assume that there has been an impact. Now one could also argue that bank credit quality has been the beneficiary of a more restrained banking system and there is likely some truth to that. That said, the ability to strike a better balance and not necessarily forego good loan growth just because the loan falls into a category which gets a very punitive weighting in the most recent stress test could help stem some of the share loss we have seen over time. In sum, for the first time in quite some time, the regulatory environment may finally become a net positive to the group which we could see being a tailwind over the next few years as more details emerge.
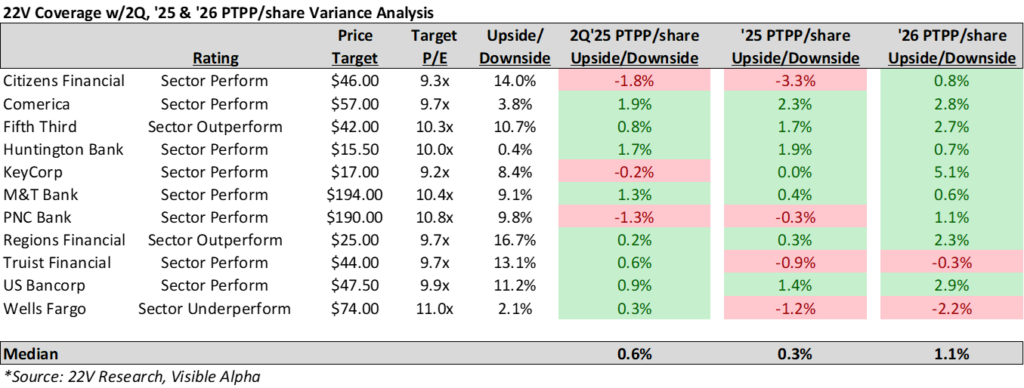
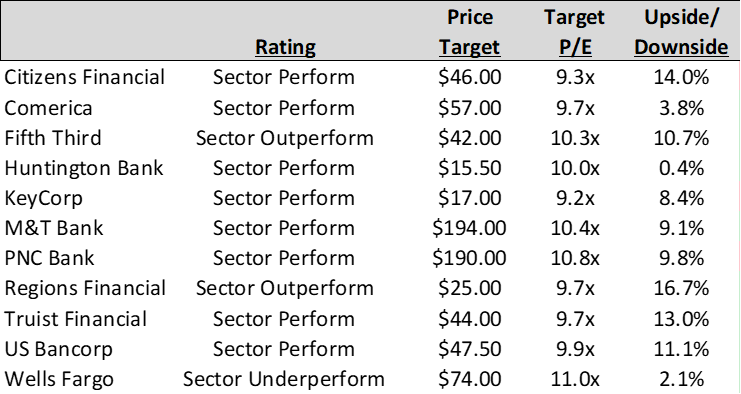
How are we thinking about picking stock picks from here? We’re trying to strike a balance between names where we see upside to pre-tax, pre-provision estimates with solid profitability metrics as a result of diversified business mixes at reasonable valuations. In addition, we look at relative price performance of the peer group and try to take advantage of disparate performance that may not be consistent with where numbers are moving/have moved. We think the tariff uncertainty is likely to persist for a few quarters obviating the need to take any big leans in the short term. To that end, we’re highlighting relative outperforms in Fifth Third (FITB) and Regions Financial (RF) and a relative underperform on Wells Fargo (WFC).
Fifth Third (FITB) Sector Outperform: We’re initiating FITB with a sector outperform. We view FITB as a solid diversified name that we think should do well regardless of the environment, but we do believe that if uncertainty continues, FITB will be well positioned. A few things that stand out to us on the positive side:
- NII growth – FITB has already guided to record NII this year. We’re at 6.5% NII growth (above their 5-6% guide)
- Balanced Loan Mix – 62% Commercial/38% Consumer. Commercial real estate ~15% of the total loan mix which is on the low end of peers with CRE NCO’s being only 6bps in the last 12 months – one of the best among peers.
- Balanced Fee Mix – 5 sources of fees each account for >10% of fees. Commercial payments at 21% a highlight for them with top market shares in a number of product categories. Capital markets revenue is 14% of revenue with 40-45% coming from hedging, 45-50% from DCM & Loan Syndication and 10-15% from M&A. Full year guide was reduced on Q1 earnings from +3-6% to +1-3% which we think is appropriately conservative.
- Southeast Strategy – We’ve been a fan of FITB’s de novo buildout in the Southeast which we view as the most shareholder friendly way of growing in that region. FITB expects to have ~50% of their branches in the Southeast by 2028. We think this has helped accrue to both loan and deposit growth relative to peers.
- Restart of the buyback in 2H’25 – Expecting to repurchase between $400mm-$500mm.
- Pre-Tax/Pre Provision Upside – We have 1.4% PTPP/share upside in ’25 and another 1.5% in ’26. With YoY average loan growth already up 3.5% in 1Q, we think average loans can come in at the top end of their FY’25 4-5% guide.
- Price Target of $42 or ~11% upside from here.
- Risks: Credit – While their criticized loans have been down the last few Q’s, they did have a pop in non-performers. Management did not change their NCO guidance and remarked that they were working through the credits and think they have good visibility on ~40% of those credits resolving over this Q and next Q.
Regions Financial (RF) Sector Outperform: We’re initiating RF with a sector outperform. Our rationale for RF is a combination of a much better than average peer return profile, some swap headwind abatement as we go into ’26, and what we believe to be doable goals for NII and fee growth this year – both derisked from January.
- NII growth: 1-4% this year which bakes in stable loan growth. We estimate ~3% NII growth which is driven by back book reprice, consistent deposit beta experience w/1Q, a gradual lessening of swap headwinds and the pull through of the securities repositionings of the last 5 quarters which management has indicated are essentially done. With the bar set low on loan growth, they have the potential for upside if the environment improves in 2H’25.
- Fees: Like FITB, RF was quick to adjust their fee guide back in April to take into account the altered environment. They have been calling out the low end of the $80-$90mm in capital markets revenue since then so like loan growth, we think the bar has been set appropriately to allow for any upside should M&A activity pickup.
- Allowance: 1.81% vs. CECL Day 1 of 1.62% gives them the room to release over time assuming credit stays as expected.
- Pre-Tax/Pre Provision Upside – We have 0.3% PTPP/share upside in ’25 and another 2.3% upside in ’26 driven by better NII growth relative to consensus.
- Price Target of $25 or ~17% upside from here.
- Risks: Credit: They have had a slight uptick in commercial criticized in the last few Q’s and have guided to the upper end of the charge-off range for ’25 (higher 1H vs. 2H).
Wells Fargo (WFC) Sector Underperform: We’re initiating WFC with a sector underperform. Our rationale for WFC is a combination of items that we think could weigh on the near-term relative performance. That said, the WFC balance sheet is in excellent shape, they have executed on the turnaround and should capital markets pick up more quickly, WFC would likely be a beneficiary. Our near-term thoughts are as follows:
- NII growth: We’re below their 1-3% growth guide this year. While they have called out the low end already, we’re looking for NII up only 0.2% this year partially due to a weaker than hoped for loan growth guide (very little) coming out of the asset cap. WFC also called out the volatility in the trading NII at a recent conference and talked about how some of the geography of revenue may start to shift around as they grow this business (potentially more in trading, less in NII) which investors will need to digest.
- Expenses: On the expense side, WFC is still doing their risk and control work so the asset cap removal is unlikely to cause a significant delta in near term expense run rate.
- 15% ROTCE target: With WFC’s ROTCE right at their 15% target, incremental moves upward will take time. While we think we can see further improvement over time, the majority of the improvement (8% up to 15%) has already happened.
- Performance since last earnings: WFC has been an outperformer relative to peers since 1Q earnings even with one of the largest negative PTPP revisions (see below).
- Pre-Tax/Pre Provision Downside – We currently have 1.2% PTPP downside to our ’25 estimates.
- Price target of $74 or essentially 2% upside from current levels.
Risks to being underweight: WFC continues to be in an excellent capital position. We would continue to expect them to be buying back a similar amount of stock relative to last year. While the capital markets side of the ledger has been muted ex-DCM, there could always be positive surprises.
Pulling it all together: In sum, while we expect the forward environment to be choppy around rates and tariffs, we are relatively positive on what’s going on behind the scenes when it comes to bank balance sheets. As long as credit remains fairly benign, we expect the back book reprice to continue, swap headwinds to improve on the margin, and deposit costs to stay benign. We also think the more accommodative regulatory posture going forward around capital tailoring and a reexamination of rules and processes over the last 15 years can accrue to the banks over time. As clarity on the economic outlook improves, we think the banks could see better sentiment and underlying demand on both the loan and fee side as we move into the latter part of ’25 and into ’26 hence our constructive stance.