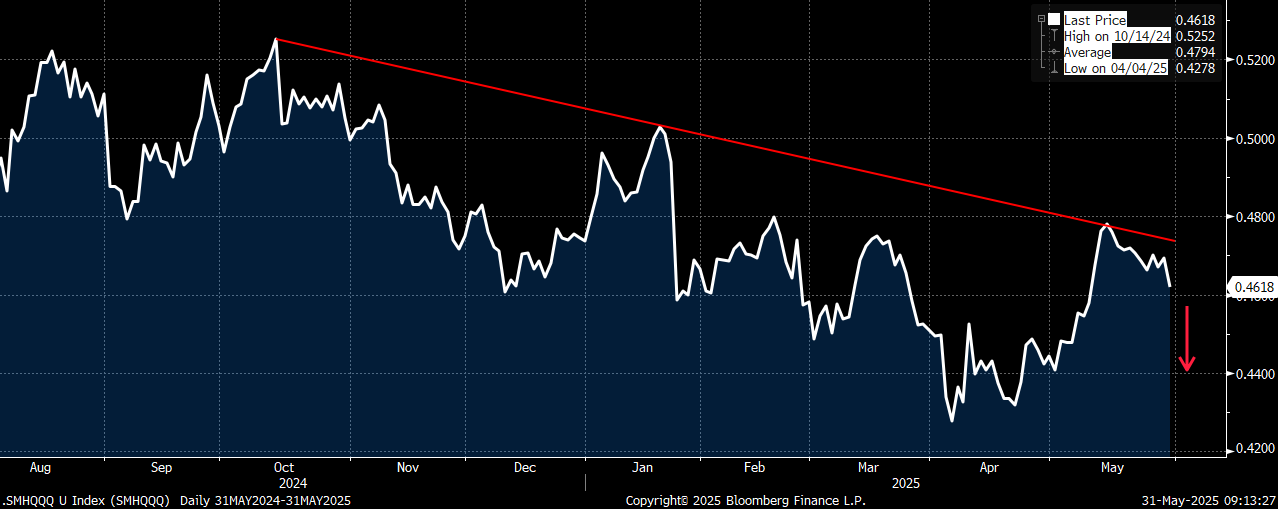
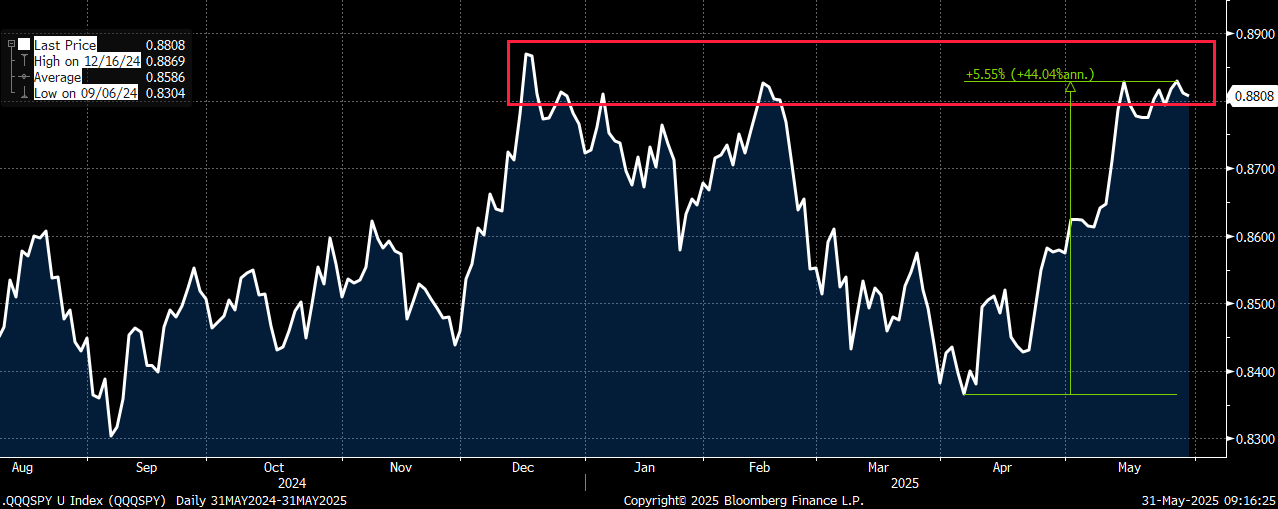
All three of the main indices closed higher last week, with small caps continuing to underperform (a theme I have been highlighting for some time now). While the Nasdaq (QQQ) and S&P (SPY) enjoyed their best months since November of 2023, they both ended the month at about the same levels they were at on May 15th (meaning all the gains were in the front-half of the month). Since mid-May the market has been “violently” flat, with somewhat large daily intra-day moves, but with no real overall direction. There are, however, a few signs I am seeing now that make me a bit cautious as to where the market may go from here. First, the semiconductors (SMH) have stopped leading the overall tech trade. I mentioned last week in my note that there was already a fair amount of weakness in SMH below the top-3 names (NVDA, AVGO and TSM). This past week we got overall positive earnings and guidance from NVIDIA, yet the stock wound up flat on the two trading days post-earnings. If the top names that have been holding up SMH can’t rally much further, it seems unlikely that the overall group will perform well. With that being said, the SMH/QQQ relative spread rallied up to the October downtrend, and is now rolling over, which could be signaling that the tech-led market rally may be at least ready for a pause (or pullback). In addition, this relative weakness in the semis is also coming at a time when the QQQ/SPY relative spread also rallied ~ 5.5% off the April lows and right back to the Dec/Feb highs. Since we know that tech leads, it may be hard for the overall market to move materially higher from here if tech starts to underperform. Against this backdrop, we had President Trump sounding tougher on tariffs Friday, saying China has violated its agreement with the US, while also doubling steel import tariffs from 25% to 50% late in the day.
SMH/QQQ relative spread peaked in mid-May (at the October downtrend resistance) and now appears to be rolling over
QQQ/SPY relative spread rallied 5.5% off the April lows and back to the Dec/Feb highs where it peaked
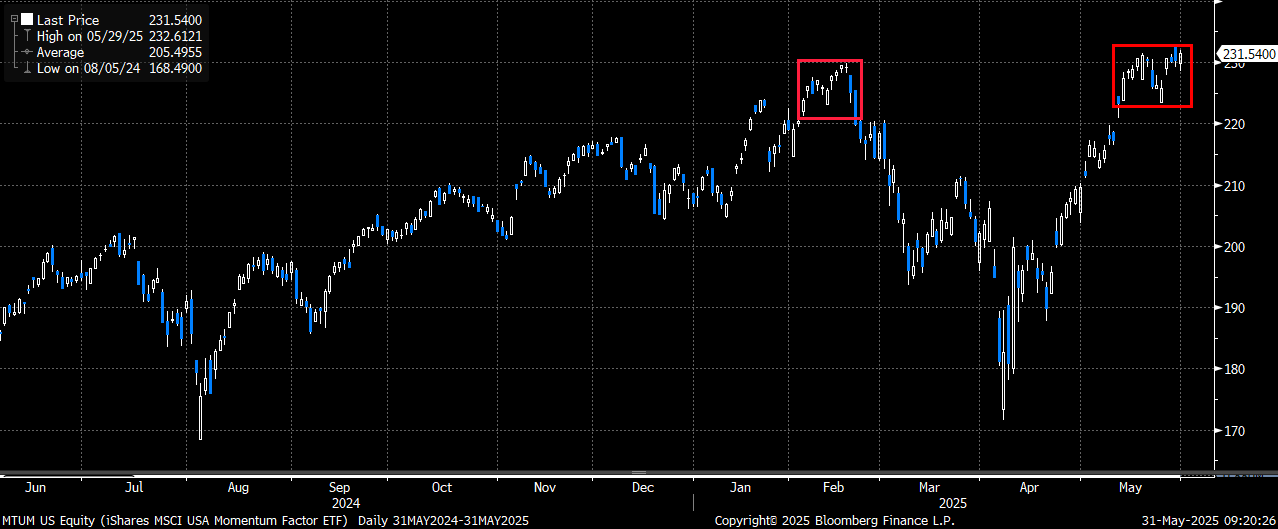
The other concern I have is with the momentum names now doing a lot of the heavy lifting for the main indices. This can clearly be seen when we look at the relative spread of the MSCI US Momentum Factor ETF (MTUM) versus SPY. That spread is now up 12.3% since the March lows, and was up ~ 4% in May, after a 4.6% gain in April. Since the MTUM ETF is comprised of all large-cap names, and it has an 87% correlation to SPY, that type of outperformance speaks to the massive piling into the names that are “working”. MTUM is now back at/above the Feb highs (even as SPY remains ~ 4% below the highs). Recall, we saw the momentum trade turn sharply lower back in mid-Feb, which led to the first pullback in the market, before the second sharp selloff on the “liberation” day tariff announcements. Much like with semis leading the overall tech trade, should the market lose this momentum bid, then the markets likely could see some weakness after a sharp 2-month rally off the lows.
MTUM/SPY relative spread now up 12.3% from the March lows
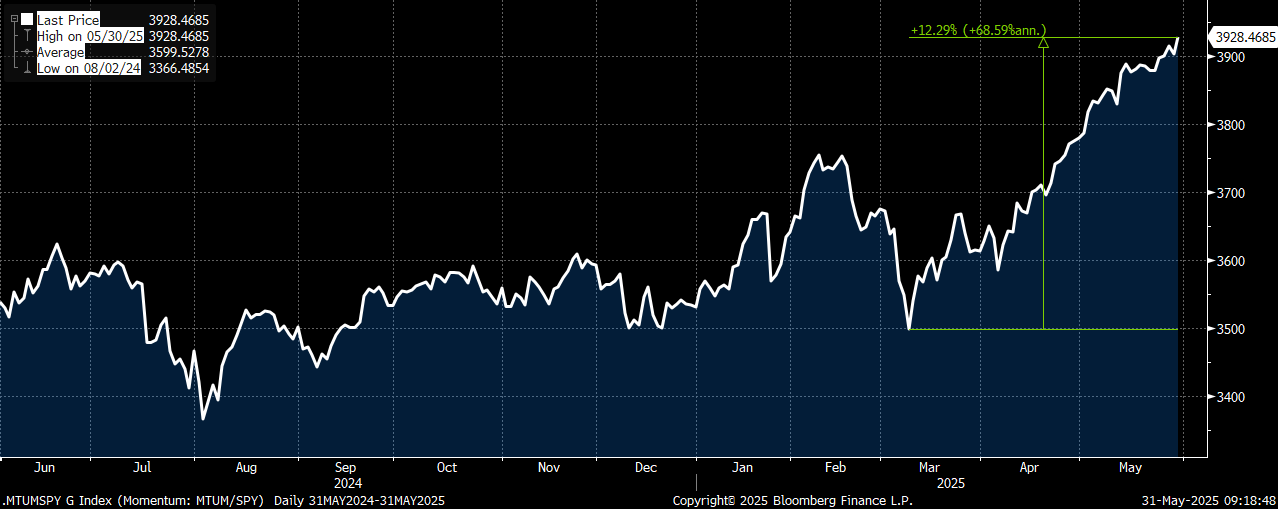
MTUM chart – sharp rally off the April lows right back to the Feb highs. The market turned down in Feb, led lower by the same momentum names that brought it higher
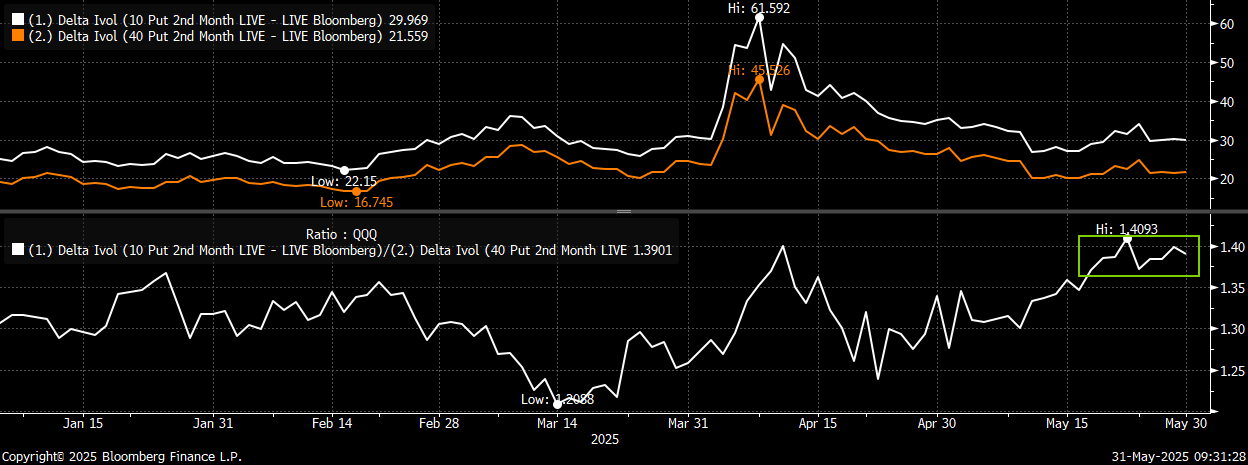
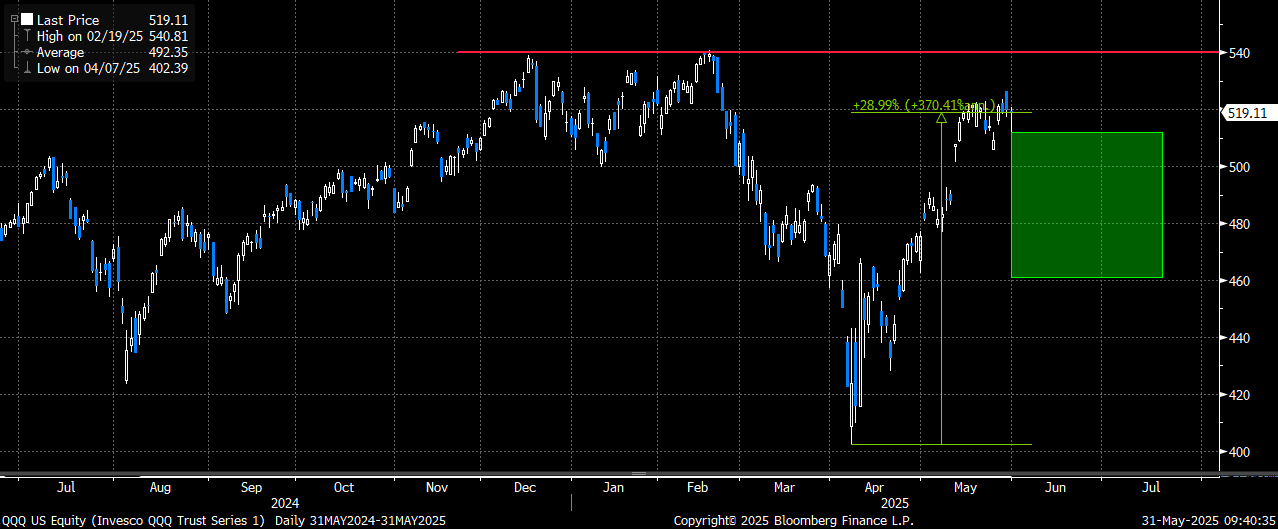
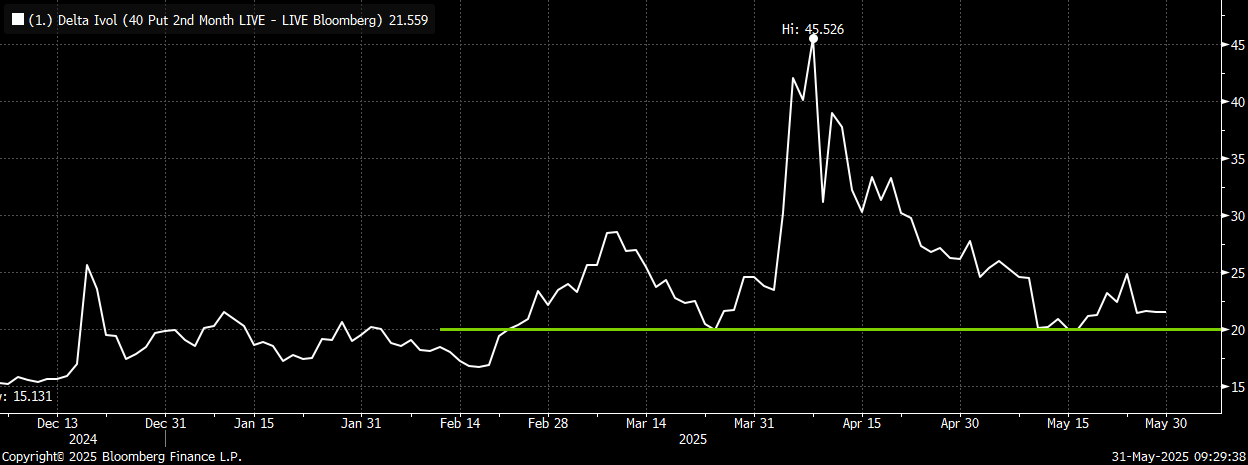
Given this setup, I think it is advisable to consider adding hedges. While I continue to like owning small cap (IWM) hedges, I think large cap tech (QQQ) hedges should now also be considered. Again, there are signs of possible “exhaustion” in the tech trade with QQQ up 29% from the April lows, the semi trade possibly stalling, and the momentum factor back at the highs and sharply outpacing the gains of the overall market. I also like the fact that the QQQ/SPY relative spread is back to the levels where that trade has turned lower the last few times it got here. Looking at QQQ July vol, we see the 40-delta puts trading at an implied vol ~ 21.5. This is down more than 50% from the April highs and just above what looks like what may be a “floor” to vol ~ 20 (recall I pointed out a few weeks ago that vol (VVIX) stopped going down even as market rallied. In addition, with the move lower in vol on the 40-delta puts, there remains a decent bid to the 10-delta puts. Therefore, the 10d/40d put skew is now back the year-to-date highs (makes owning wide put spreads an attractive proposition).
If looking to add QQQ hedges, I like the following trade:
Buy QQQ July 510 Puts (38d, 21.7 vol)
Sell QQQ July 460 puts (11d, 29.4 vol)
Costs ~ $8 (QQQ 519.11 Fri close ref)
Trade Details:
- Buying the QQQ July put spread following the nearly 30% rally off the April lows (less than two months)
- The QQQ/SPY relative spread back to the recent highs, and the semis have started to underperform (could be a harbinger for the overall tech trade to turn lower)
- Momentum factor trade in peak mode, much like we saw in Feb before it turned sharply lower and brought the indices with it
- Put skew back at the 2025 highs, so selling the 11-delta 460 put covers more than 25% of the cost to own the 510 put which is now less than 2% below spot
- Prefer QQQ hedges here to SPY given outperformance, as well as QQQ put vol trading near the low-end to similar delta SPY puts
- Trade offers an attractive 5.25x to 1 max payout and July expiry allows nearly seven weeks for hedge to work (market was THIRTY percent lower seven weeks ago)
- Please reach out to me or the 22V sales desk for updated pricing and execution capabilities
QQQ up nearly 30% from the lows and now just below the Dec/Feb highs ~ 540. The GREEN area shows where hedge trade works by July expiration
QQQ 2-month (July) 40-delta put vol down from 45 and now just above the “floor” ~ 20
QQQ 10d/40d put skew back to the 2025 highs (bottom chart)