

With this morning’s release of the updated GDP data for Q4, we got our first look at the National Accounts version of the current account. The deficit there narrowed from 4.1% of GDP in Q3 to 3.7% in Q4. This recovery reflected a decline of the net exports deficit ex petroleum, a rise of the petroleum surplus, and marked recovery of net income payments related to cross border equity holdings. Specifically, the sum of US dividend receipts from abroad and reinvestments of retained earnings overseas (which tend to be inversely correlated) rose by 30 basis points of GDP.
It seems likely that the current account deficit will have widened back to its Q3 value – or beyond – during Q1. And I think there is a good chance that at the current foreign exchange value of the dollar, the current account deficit is probably headed to around 5% of GDP. When I invoke the role of the dollar here, I refer to its direct effect on trade and to it reflecting an interest rate advantage that is itself a function of stronger demand growth in the US than overseas. If that growth differential were to narrow, then the dollar’s yield advantage would weaken, the dollar would fall, accommodating a decline in the net exports and current account deficits. The dollar’s role would not be entirely (or even mostly) causal. But if our interest is the dollar per se, then that does not matter. The point here is that the dollar is now at a level from which the risks now seem to be tilted to the left. Having said that, news of a meaningfully narrower current account deficit during Q4 is a minor mercy.
Broad recovery of current account during Q4
(Probably not a trend, though)

Source: BEA, FH calculations
Data are actual to 2024 Q4.
If the current account deficit were to go to 5% of GDP and nominal GDP growth were to grow at a trend rate of 4%, then America’s net international investment position would approach 125% of GDP along a flattening tangent. I mention this not because it is likely. Events will intercede to make something else happen. Rather, the point is that a 5% of GDP current account deficit is large enough to matter, which is in contrast with the 2% deficit to which we became accustomed until recently. The 125% of GDP figure involves a couple simplifications for illustration. First, it assumes that all the international assets involved here are fixed income. To the extent that the US has a negative position in real assets related to equity investments, there would be some tendency for the net international investment position to be “worse” than 125% of GDP. And, of course, as the net external debt rises, it would take an ever-narrowing deficit in net exports to sustain a current account deficit that is stable at 5% of GDP, because the investment income balance would be moving steadily into deficit. But I am using round numbers here and trying to keep it simple to emphasize a qualitative point.
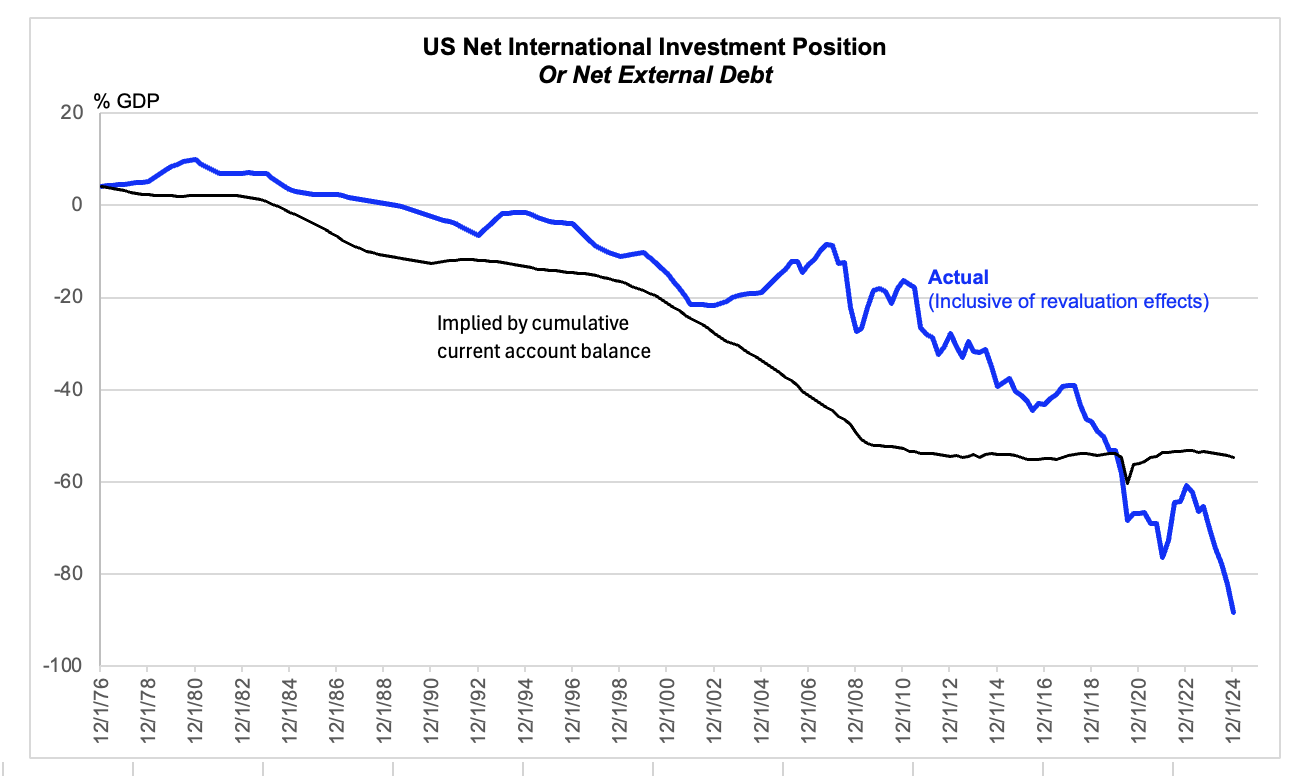
Revaluation effects dominating net international investment position
(Current account itself may soon take over)
Source: BEA, FH calculations
Data are actual to 2024 Q4.
During the past several years, the combination of the actual current account deficit and the path of nominal GDP have alone implied that the net international investment position might stabilize at about -60% of GDP, as indicated by the thin line in the chart above. A big reason for this is that nominal GDP, the denominator, was strongly stoked by the post-Covid inflation. But presumably that will not happen again, and the current account deficit is now larger than it was and – I assume – inclined to widen a bit further.
This morning, we learned how revaluation effects complemented the trend in the current account deficit to influence the net international investment position. And the effect was extreme. Even though the current account deficit was small enough itself to imply no change of the net international investment position (given the rise of GDP), the net international investment position deteriorated shockingly from -82% to -88% of GDP. This was almost entirely a function of higher US risk asset prices, as I will get to below. But for now, I would just point out that if valuation effects were stable from here, just for the sake of argument, the NIIP would deteriorate towards that -125% of GDP figure that I set out. And the deterioration would be from -88%, not -60%, just to be clear.
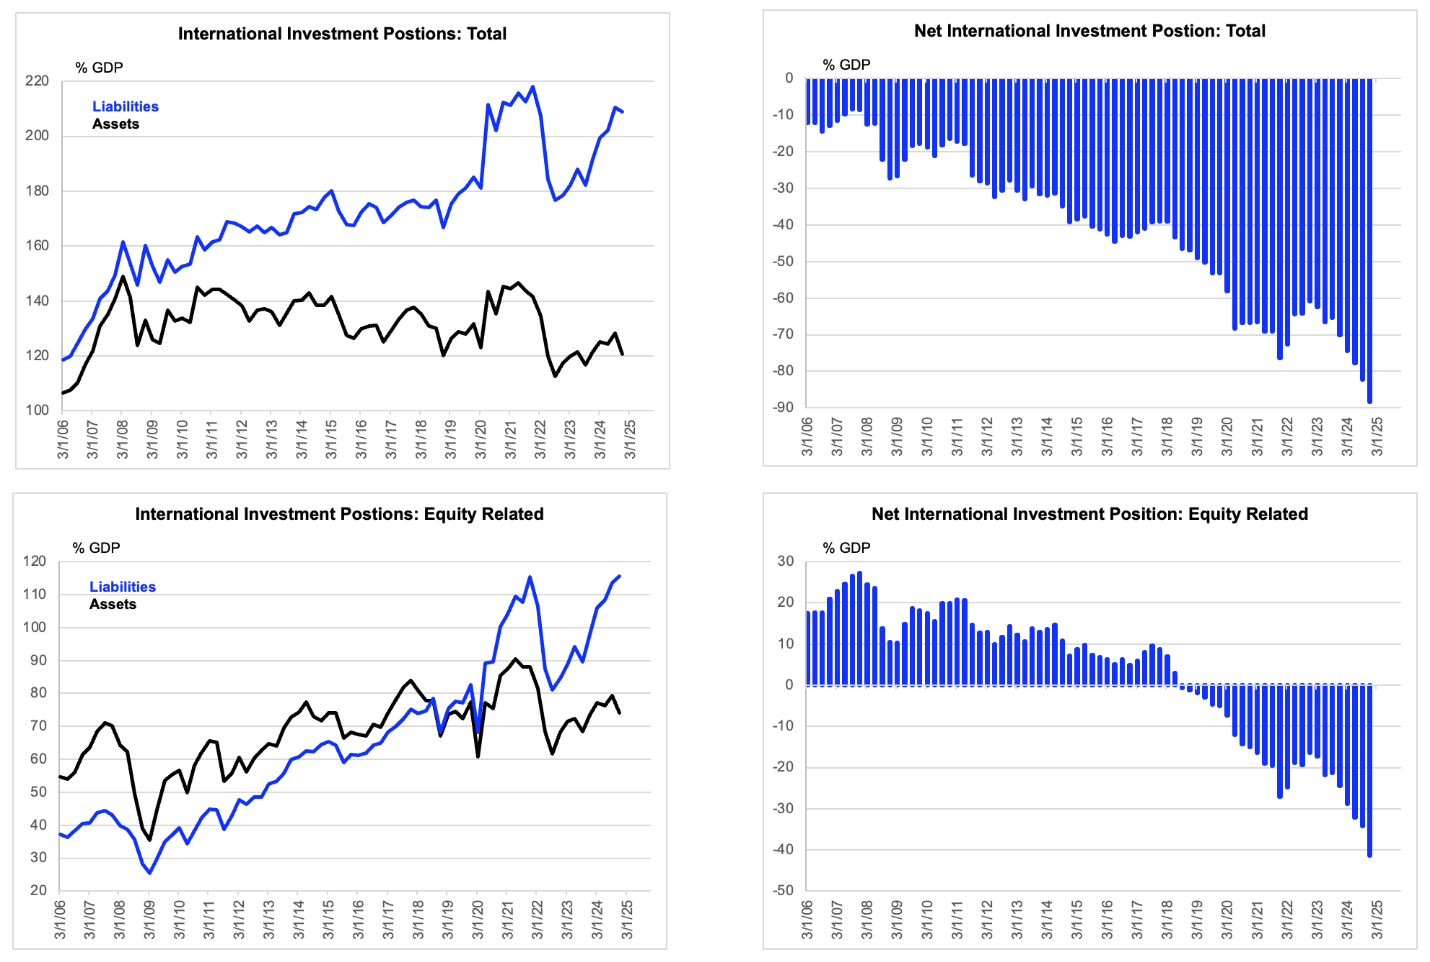
Deterioration of Net International Investment Position Driven From Equity Side
Source: BEA, FH calculations
Data are actual to 2024 Q4.
Compositional detail
As you can see from the chart above, all the decline the net international investment position in Q4 – as is recent years – has been concentrated in “equity related” positions, comprising foreign direct and portfolio investment here and our investments in similar assets overseas. In the interest of space, the chart does not show non-equity, which is overwhelmingly fixed income, but the net international investment position there has been stable at around -40% of GDP. There have rapid purchases of US fixed income, but the cumulative effect on that has been overwhelmed by the rapid growth of nominal GDP, around the Covid shock, but also to a lesser extent recently as well. Taken in isolation, the quickly growing nominal GDP has also helped to limit the deterioration of the equity-related net international investment position, but the risk asset rally has trounced that effect several times over.
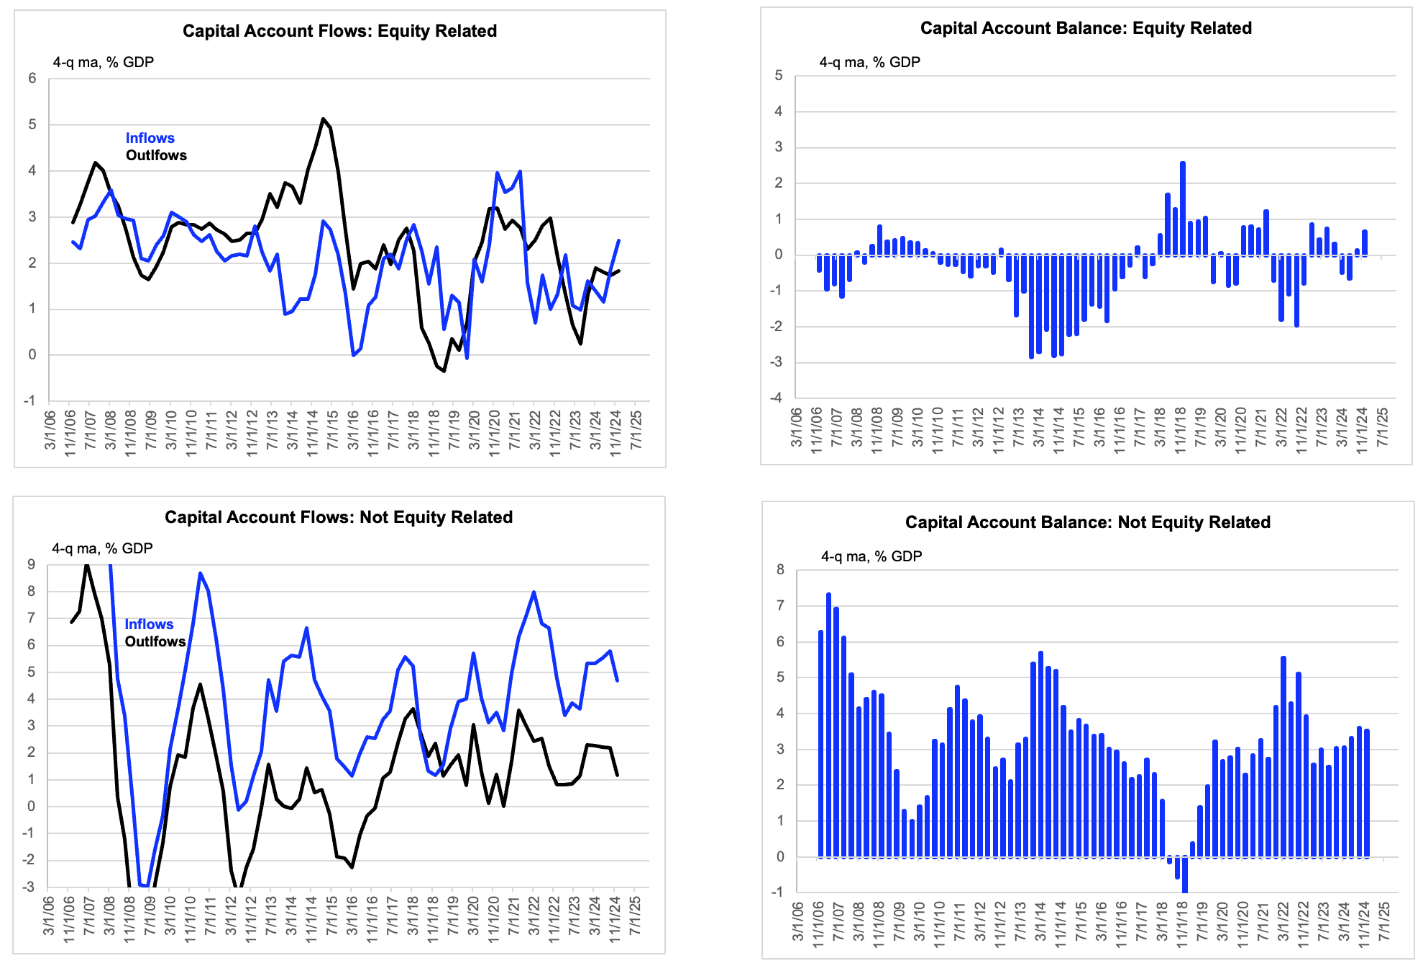
Of course, the net international investment position will also be influenced by capital flows. After all, there would be no room for revaluation effects to matter at all, were it not for foreign purchases of US real assets at some point. But as you can see from the chart below, net equity related inflows have been very modest in recent quarters and years.
On the other hand, net inflows via fixed income have remained extremely strong and will probably have to accelerate further to finance the widening current account deficit (given the odds against equity flows assuming that burden implied by history). In the chart I depict fixed income flows as “not equity” to respect the fact that the government data have specific line items related to “debt” that exclude deposits and currency. The debt flows look similar if marginally smaller, but I think what I present is more representative of reality. To be honest, I was a bit surprised when I looked into this because my thinking here had been distorted by news that official flows into US Treasurys had slowed. Those flows have been replaced, at least for now.
Anyhow, this look into the detail tends to reinforce a point I have been pushing. These flows are now large enough to suggest we should be worried about their sustainability with the foreign exchange value of the dollar near its current level. That is why I see the risks around the dollar tilted to the left over the medium- to longer-term term, although short-run swings in the dollar will continue to be dominated by news regarding tariffs and by economic data bearing on the monetary policy paths here and overseas.
Flows have been concentrated in fixed income, though
Source: BEA, FH calculations
Data are actual to 2024 Q4.

