

The financial position of the US household sector remains quite strong in aggregate – and is a key source of resilience in the cyclical expansion. This strength can be confirmed through our regular monitoring of quarterly data in the Fed’s US Financial Accounts, which were updated through the Q4 earlier this week and are the focus of this note.
I have been arguing for about three years now that solid household sector finances (and private sector finances generally) are largely a reflection of the large federal budget deficit. There are other supportive influences as well, but I like to highlight the fiscal issue because it is particularly important and because my take here runs contrary to a widely prevailing but seemingly mistaken piety.
The federal debt / GDP ratio is at its highest level since just after the second world war – and is rising steeply. More importantly, market-based measures of forward r* suggest that the r*-g* gap is no longer green lighting aggressive fiscal expansion, as it had for the decade ending about two years ago. As a result, it is probably appropriate for the federal government to begin a gradual fiscal tightening. There is no need to eliminate the fiscal deficit. And there is probably no need even to reduce the debt / GDP ratio from its current level. It is conceivable, although not guaranteed, that merely slowing the rate of ascent of the debt / GDP ratio would be sufficient to avoid fiscal strains for the foreseeable future. Still, somewhat tighter fiscal policy than is currently built into the consensus and reflected (among other things) in forward Treasury yields would probably be prudent. [1]
The thing is, though, the case for some fiscal consolidation is widely recognized, and it probably receives undue attention, among observers if not in markets themselves. What is seemingly less well understood and is more immediately relevant is that the large deficit has allowed the economy to obtain a level of aggregate demand that is consistent with full employment and a tolerable outlook for inflation, without relying on the private sector bubble dynamics that were required to sustain aggregate demand during the 1990s and 2000s, when fiscal policy was inappropriately orthodox. As a result, the economy seems much less vulnerable to private credit strains or to a landslide in aggregate demand than it was at the turn of the century, late in the 2000s, or even during the initial recovery from the GFC.
I hasten to add, as usual recently, that resilience is not the only macro theme relevant to the current environment. With sufficiently inflationary policy, the Trump Administration can create the need for a deep slowdown of demand growth and a related rise of recession risk. But the economy is not an accident waiting to happen. The large fiscal deficit is an important reason for that. And we can see an image of it in the aggregate financial position of the US household sector.
Source: BEA, Federal Reserve, FH calculations
Data are actual to 2024 Q4.
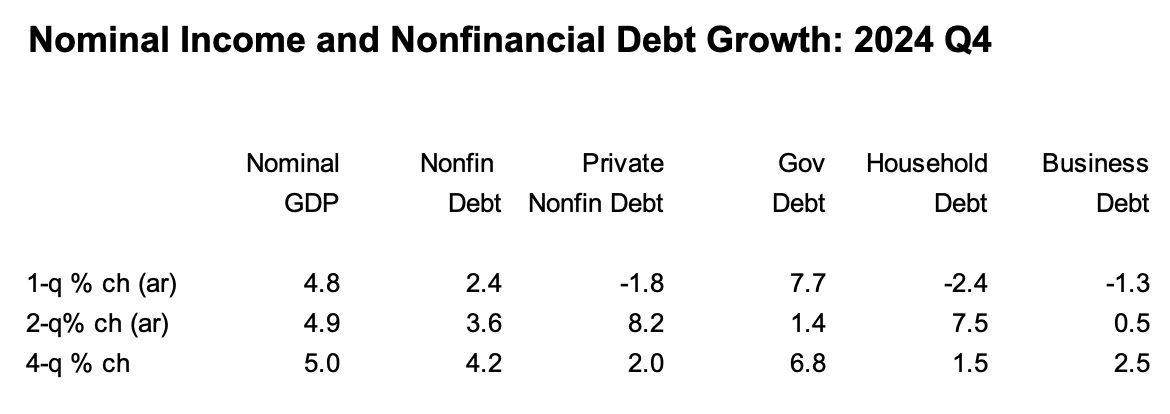
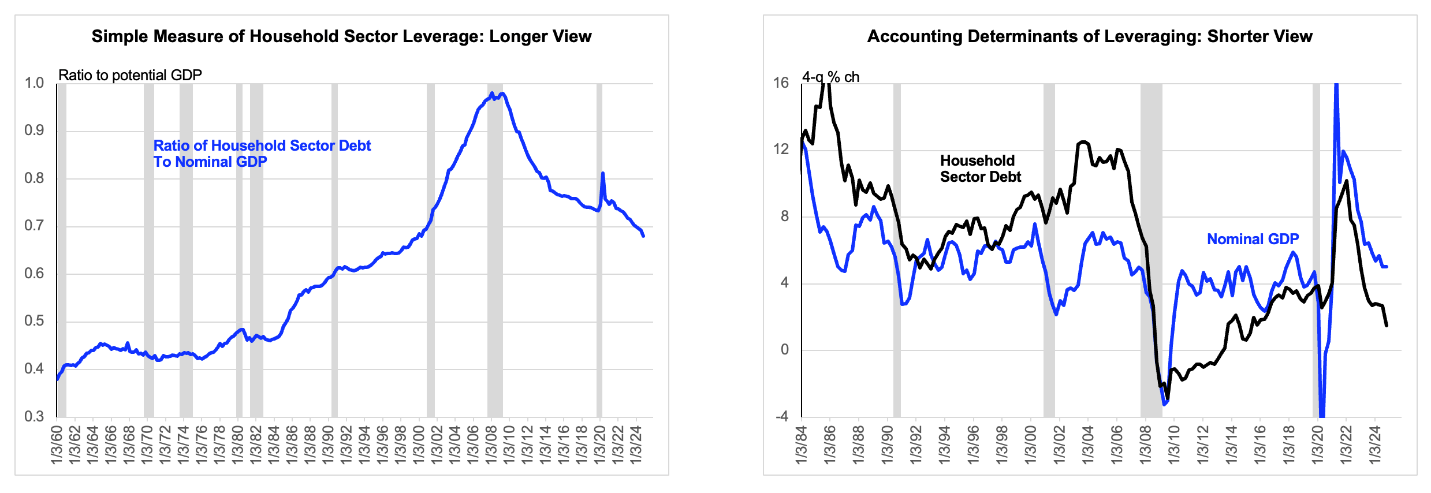
Let’s turn now to the data from the US Financial Accounts. During the fourth quarter, household sector debt actually contracted at an annualized rate of 2.4%. The 2-quarter growth rate was near zero, and debt was up 1.5% vs year ago. So, household debt growth has been generally low, and the pattern has been one of deceleration, although I am obviously not inclined to extrapolate that deceleration. Meanwhile, nominal GDP growth has been fairly steady near 5% over the past year, which means that the simplest measure of aggregate leverage in the household sector has been declining, as I will discuss a bit briefly below. As an aside, you may note in the table above that business debt growth has also been moderate, and that government debt growth has been strong. Government debt growth has not fully determined slow private debt growth. But in an environment in which the Fed has been targeting demand growth consistent with full employment, mostly successfully, the two are clearly related, as I have been pressing.
The simplest measure of aggregate leverage in the household sector
Source: Federal Reserve, BEA, NBER, FH calculations
Data are actual to 2024 Q4.
Slow household sector debt growth in an environment of moderate nominal GDP growth has meant that the ratio of debt to GDP has been declining, most recently at an accelerating rate. To repeat, I would not extrapolate the recent steepness of the decline. But what is more interesting is that this trend to lower aggregate leverage in the household sector can be traced back to the period immediately after the GFC. One background influence has been the shift from fiscal orthodoxy to laxity, although in fairness, US fiscal policy was somewhat orthodox during the mid-2010s. Stepping away from the general equilibrium story I would tell, though, and focusing on the more mechanical drivers, there have been three major forces behind this deleveraging:
- Immediately after the GFC, there was a prolonged period of “automatic” deleveraging reflecting that the level of credit-financed spending (such as in housing and durables) had collapsed to a point from which it could grow, even rapidly, without pushing gross borrowing above the elevated pace of amortizations related to the high level of credit-financed spending prior to the GFC.[2]
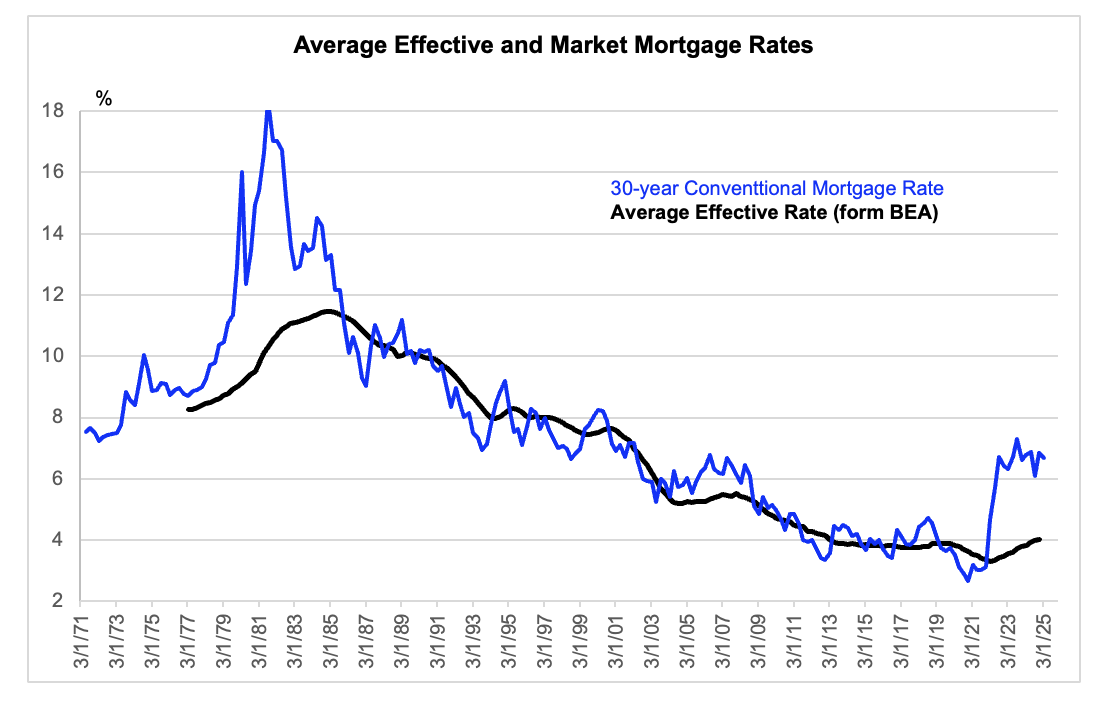
- The level of real interest rates has been moderate relative to earlier periods, such as the 1980s through 1990s, which has meant that the costs of servicing debt has put less upward pressure on the debt stock itself. This has meant that debt growth has been low even relative to the level of credit financed spending. This favorable influence will unwind over the coming years if market rates remain near current levels, but the costs to the household sector associated with this repricing will accumulate very slowly.[3]
- The credit intensity of (typically) credit-financed spending has fallen, as evidenced for (most prominent) example by the all-cash real estate buyer. The relative importance of this influence has probably been highest most recently.
Whatever the relative importance of the three mechanical drivers here, the net result has been a very benign equilibrium condition that I would say has received insufficient attention. The economy has been able to operate at a tolerably high level of aggregate demand with the household sector deleveraging steadily. We have not had to rely on bubble dynamics in this part of the macro story, just as we have not had to rely on it in others.
Effective interest rates have stayed low, especially in the housing sector
Source: BEA, Federal Reserve Bank of St. Louis (FRED), FH calculations
Effective mortgage rate is actual to Q4. Mortgage rate is actual to the week of March 20 and converted from weekly to quarterly.
It may seem odd that the household sector has not had to rely much on credit support to finance its spending given that the personal saving rate has been so low. But keep in mind that the household sector’s accumulation of real assets, via gross investment, has also been low. So the household sector has not been running a financial deficit. And that means in turn that debt growth can be slow for any given pace of financial asset accumulation. So, the household sector has been able to stay liquid, despite its relatively low personal saving rate. There are a lot of accounting identities floating around in this discussion. If you don’t feel like internalizing them, then you can just trust that there is no logical / accounting inconsistency here, although all these variables are measured imprecisely.
Household sector remains in moderate net financial surplus

Source: Federal Reserve, BEA, FH calculations
Data are actual to 2024 Q4.
Some observers believe that the low personal saving rate is an issue in its own right. That is, leaving entirely aside the credit implications of the low saving flow, consumers might decide that they need to speed the pace of their net wealth accumulation. However, there are two issues that would seem to undermine the strength of that argument, one technical and somewhat minor, the other more substantial.
The technical point is that the saving rate measured as a deviation from its own historical average is probably understated, because inflation is now low by longer-term historical standards and because capital gains taxes are running at an above-average pace. I have discussed these issues in earlier notes and will not repeat here.
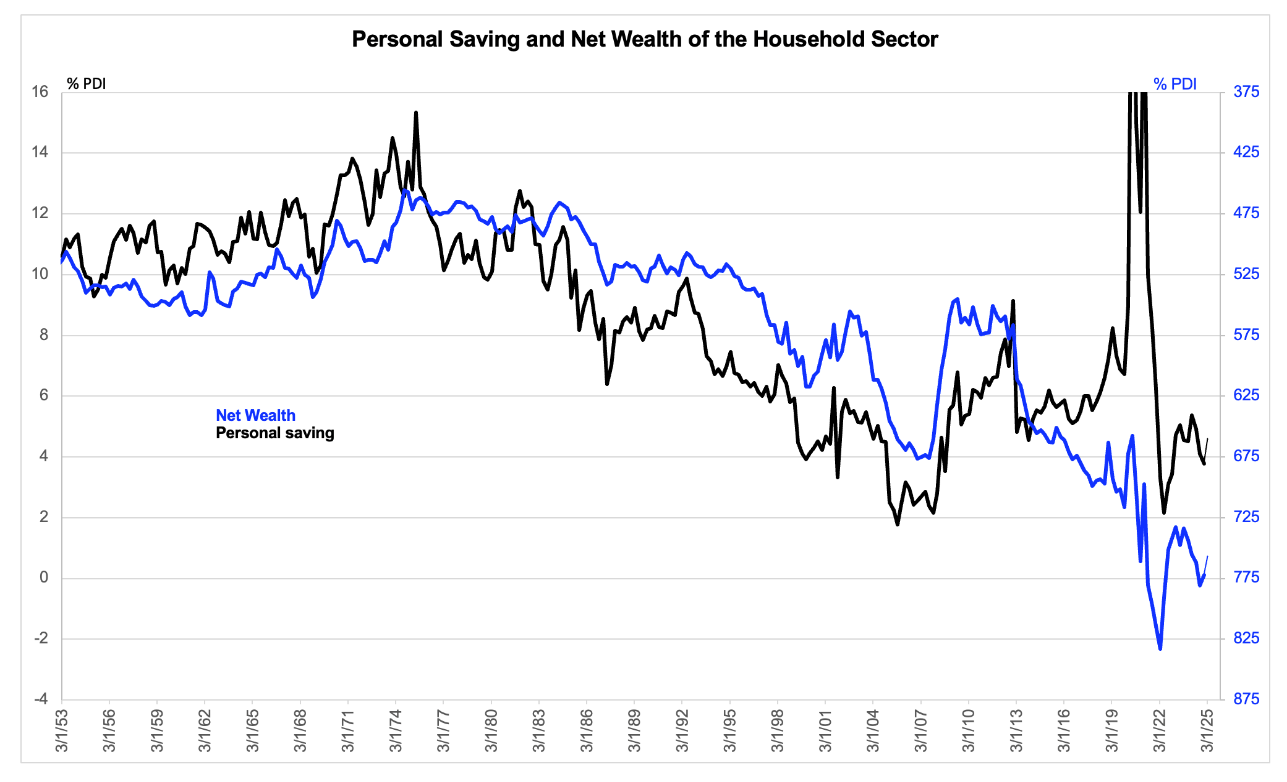
The more substantial issue is that, even as measured, the saving rate actually looks somewhat high relative to the level of aggregate household sector wealth. So, there is no obvious case for the household sector, in aggregate, to raise saving to speed the flow of their net wealth accumulation. I would concede that this does raise a relevant vulnerability. To the extent that equity holds in the household sector are now high relative to income, a given (e.g., 20%) decline in the level of the stock market would deliver a larger than typical hit to net worth and therefore, presumably, a larger than typical negative wealth effect. However, that is different from saying that the wealth is somehow fake or that consumption is somehow levitating. It would appear not to be so, and the macro risks – while obviously real – would relate to other issues, such as the tariff worry.
Household sector wealth easily rationalizes saving rate, even as slightly mismeasured
Source: Federal Reserve, BEA, FH calculations
Net wealth and the personal saving rate are actual to Q4 and estimated to Q1 based on the January level of the personal saving rate and financial asset prices on the screen at the close yesterday.
[1] Reducing the primary fiscal deficit by a couple percentage points to 2% of GDP might plausibly create new fiscal spacing simply by forcing the r*-g* gap meaningfully below zero again. That would slow the rate of ascent of the debt / GDP ratio even in the presence of a still moderately large primary deficit, as is well understood. What is less well understood and probably more important, is that the restoration of a negative r*-g* gap would make any given medium-term outlook for the debt/GDP ratio less important.
[2] I learned of automatic deleveraging from Jason Benderly of Applied Global Macro Research, just after the GFC. He taught me not to get fooled by the then widely prevailing view that deleveraging was some sort of chronic illness.
[3] JW Mason of City University of New York has documented the role of r*-g* in the context of household sector deleveraging.

