With both the S&P (SPY) and Nasdaq (QQQ) down over 2% each last week, even with the very sharp rally in the market on Friday, the thing that stood out to me was the action in volatility (VIX). After spiking on Monday and Tuesday to just below 30 (its highest reading since the August carry trade/flash crash), it only got back to a high of ~ 26 on Thursday as the indexes were making new lows. I believe this is an important distinction as perhaps the market has now become a bit more desensitized to the weakness/selling on the “same” news and, if so, it would stand to reason that the highs for vol may be in for now? At a minimum, we should expect further vol contraction if we continue to see the market rebound off the oversold conditions (VIX had its largest percent decline since mid-January on Friday).
After hitting 29 on both Monday and Tuesday, VIX was only able to get up a high ~ 26 on Thursday as markets were setting new lows

If, in fact, the highs for VIX are in, we need to think about ways to incorporate short-volatility structures for both further index hedging as well as playing for a rebound in single names. As far as hedging, I mentioned the put spread collar idea last week as a preferred way to establish lower-cost downside hedges given the higher vol environment. I still favor this structure as upside call implied vol remains bid, and I would continue to expect this to come down, especially if we should we see market rebound further. Additionally, given the severe selling and de-risking we have seen in the markets over the past month, I am not in the camp that we will see a V-shaped recovery in the indexes (like we saw in the August selloff), which would also support selling the upside calls that are not far off from the market highs. With both SPY and QQQ ~ 2% lower I would now consider similar April structures to what I suggested last week, but just move the spreads down accordingly.
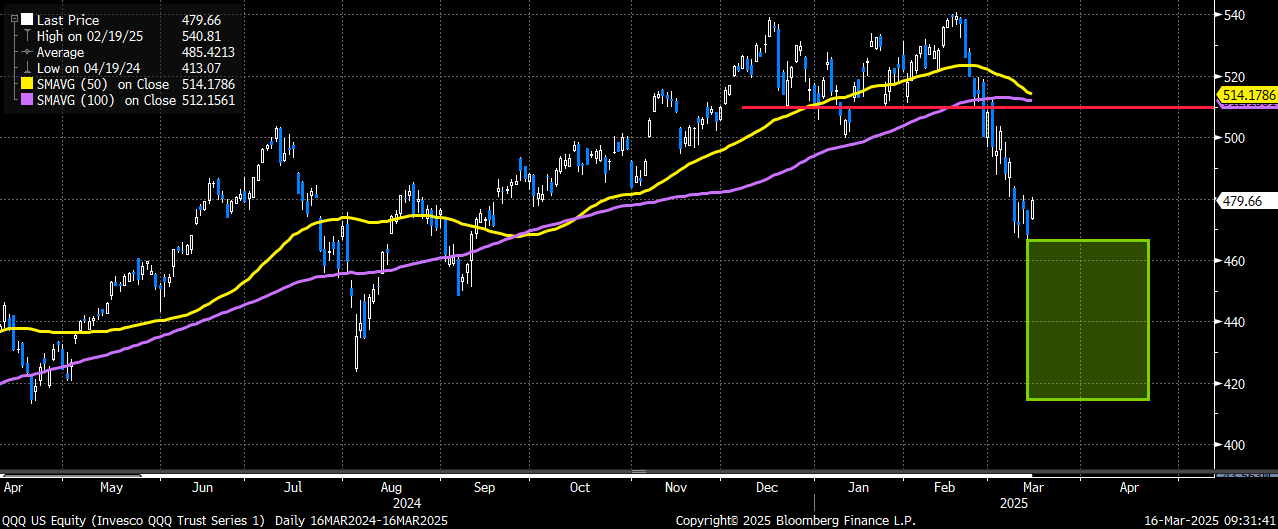
Trade #1 – QQQ April put spread collar
Sell QQQ April 510 call
Buy QQQ April 465/415 put spread
Costs ~ $4.60 (QQQ 479.66 ref)
- Selling the 6%+ upside calls to buy the put spread that starts ~ 3% below spot
- The 510 upside call strike is just below the declining 50-day and 100-day moving averages
- Put spread starts just below the Thursday lows and is capped to the downside at the April (1-year lows)
- Structure is theta neutral to start and selling the upside call and downside put covers nearly 50% of the cost of owning the 3% lower put
- Can look to establish this protective collar position here, or on further rebound off the oversold conditions
Selling the 510 call (6% higher and just below the 50-day and 100-day) to own the protective put spread that starts at the Thursday lows ~ 465
Trade #2 – SPY April put spread collar
Sell SPY April 590 call
Buy SPY April 550/500 put spread
Costs ~ $5 (SPY 562.81 ref)
- Selling the 5%+ upside call (after factoring in the 3/21 ex-div) to buy the put spread that starts ~ 2% below spot
- The 590 upside call strike is just below the declining 50-day and 100-day moving averages
- Put spread starts at the Thursday lows and is capped to the downside just above the April (1-year lows)
- Structure is close to theta neutral to start and selling the upside call and downside put covers 43% of the cost of owning the 2% lower put
- Can look to establish this protective collar position here, or on further rebound off the oversold conditions
Selling the 590 call (5%+ higher and just below the 50-day and 100-day) to buy the put spread that also starts at the Thursday lows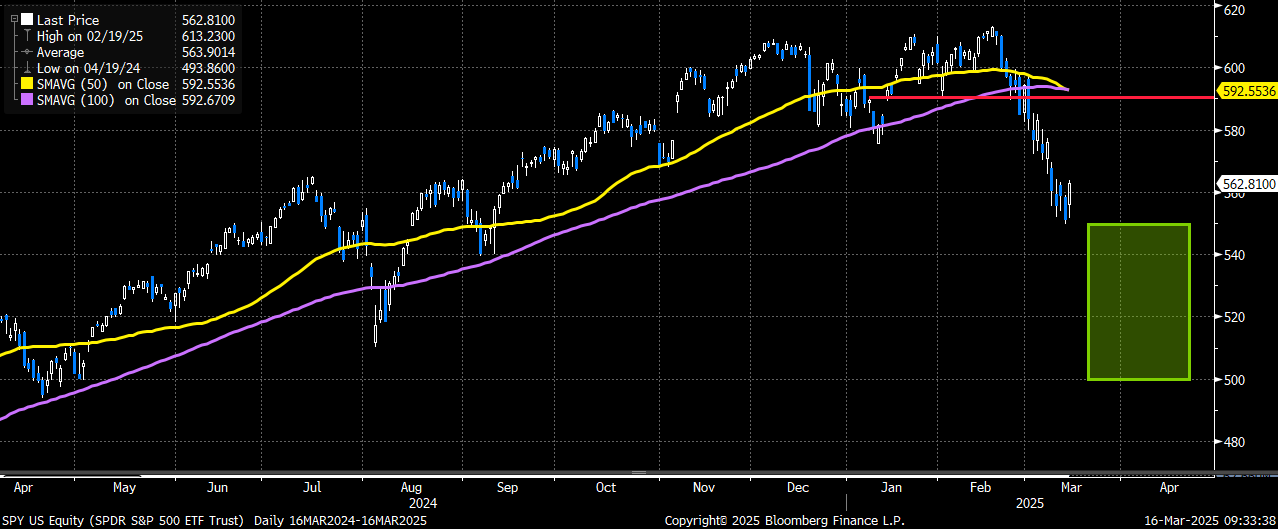
Repair strategies for single names
Given my view that I believe we may have seen peak volatility for now, I also want to discuss option structures for single names that can take advantage of elevated volatility, while positioning for a possible move back higher over the next few months. I will use Amazon (AMZN) stock in my examples as it is down nearly 20% from the highs, is universally owned, and implied vol is at the upper-end of its 1-year range. However, this price/volatility setup currently presents itself in many of the most owned/active names. Please reach out to me directly, or your 22V sales coverage, to set up a call to discuss specific names in your portfolio and similar-type structures.
Repair strategy #1 – The 1×2 call spread overlay trade if already long shares
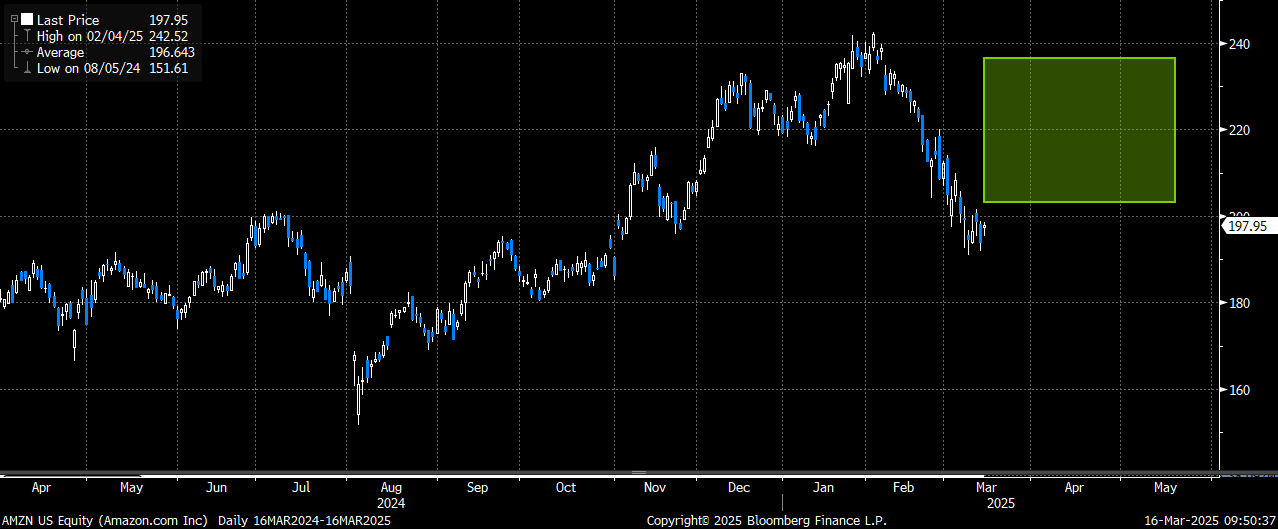
Buy AMZN May 200 calls 1x
Sell AMZN May 220 calls 2x
Costs ~ $3.60 (AMZN 197.95 ref)
- Option structure is delta neutral to start
- Trade makes money if AMZN closes between 203.60 and 236.40 by May expiry (+2.8% to +19.4%)
- Trade adds NO further downside risk to existing long equity position (besides debit on trade)
- Great way to offset elevated implied volatility, while playing for a possible move back higher
- Upside breakeven of 236.40 is not only ~ 20% higher, but is just below the Feb (all-time) highs
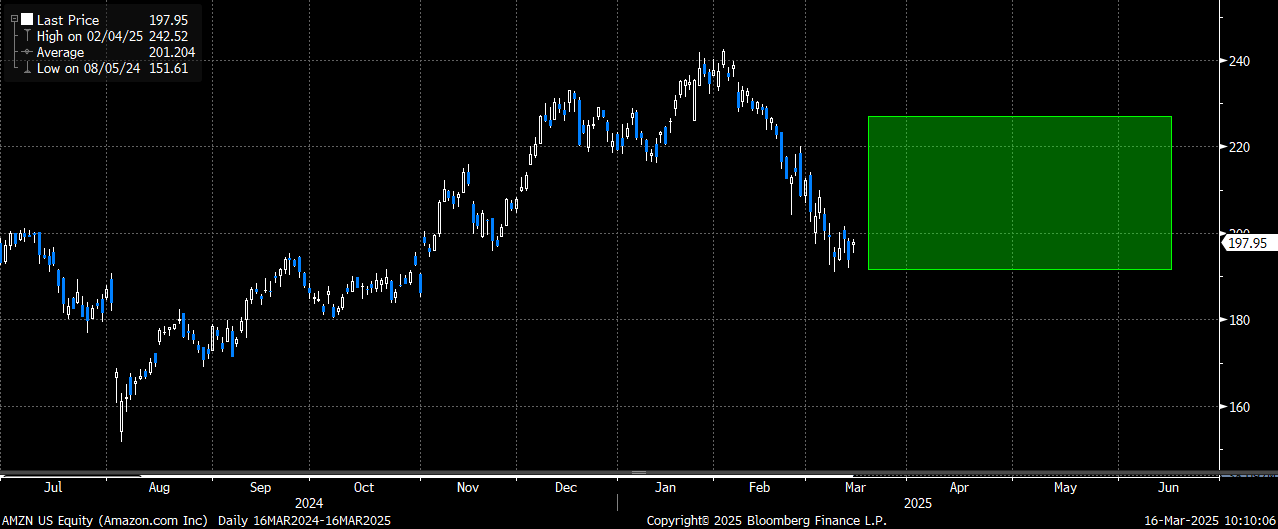
The delta-neutral 1×2 call spread overlay structure has a wide area of upside outperformance, without adding further downside risk to existing long equity position
Repair trade #2 – Buy stock and sell upside calls
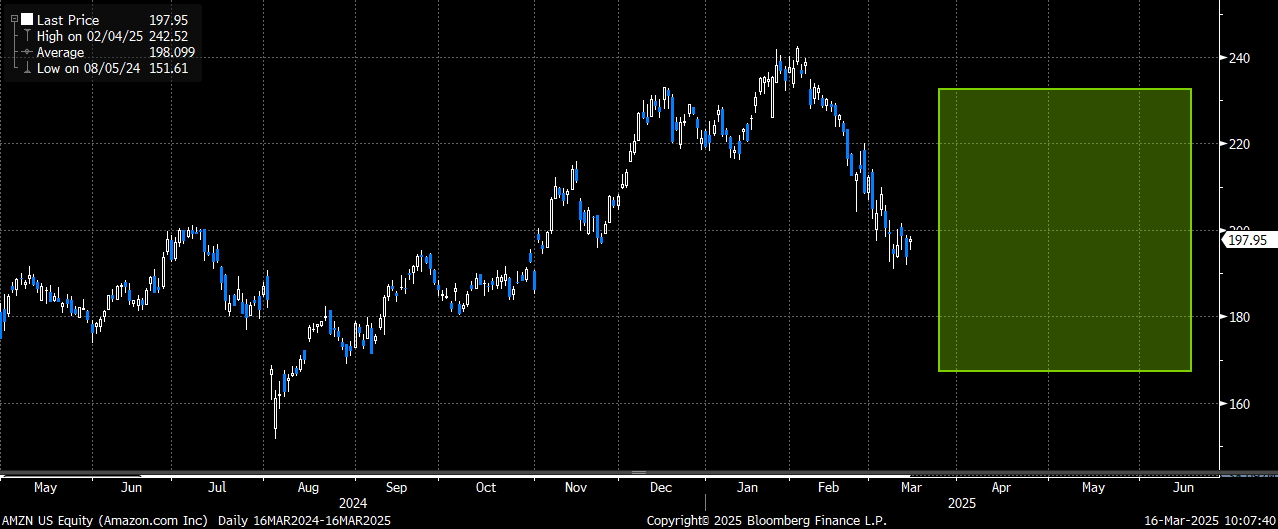
Buy AMZN shares at 197.95
Sell June 220 calls @ 5.95
- Selling the 11% 3-month upside calls against buying stock after the nearly 20% decline from the highs
- Call sale yields 3% (11.25% annualized) and brings breakeven vs stock up to $225.95 (14% higher)
- Call sale provides 3% downside cushion to stock purchase
- Would expect upside call vol to contract should stock stabilize and/or move back higher
The long stock/short call trade adds “yield” to the position while also giving trade a cushion in case of further downside
Repair trade #3 – Buy stock and sell upside calls and downside puts (short strangle)
Buy AMZN shares at 197.95
Sell June 220 calls @ 5.95
Sell June 180 puts @ 6.15
- Selling the 11% 3-month upside calls AND the 9% downside puts after the nearly 20% decline from the highs
- Strangle sale collects $12.1 to yield over 6% (23% annualized)
- Break-evens on just the strangle sale are 232.10 (+17%) and 167.90 (-15%)
- Can do trade vs buying new stock down here, or vs current exposure as trade is close to delta neutral here
The short strangle trade does give a larger upside profile, but incurs more risk since also selling the downside put