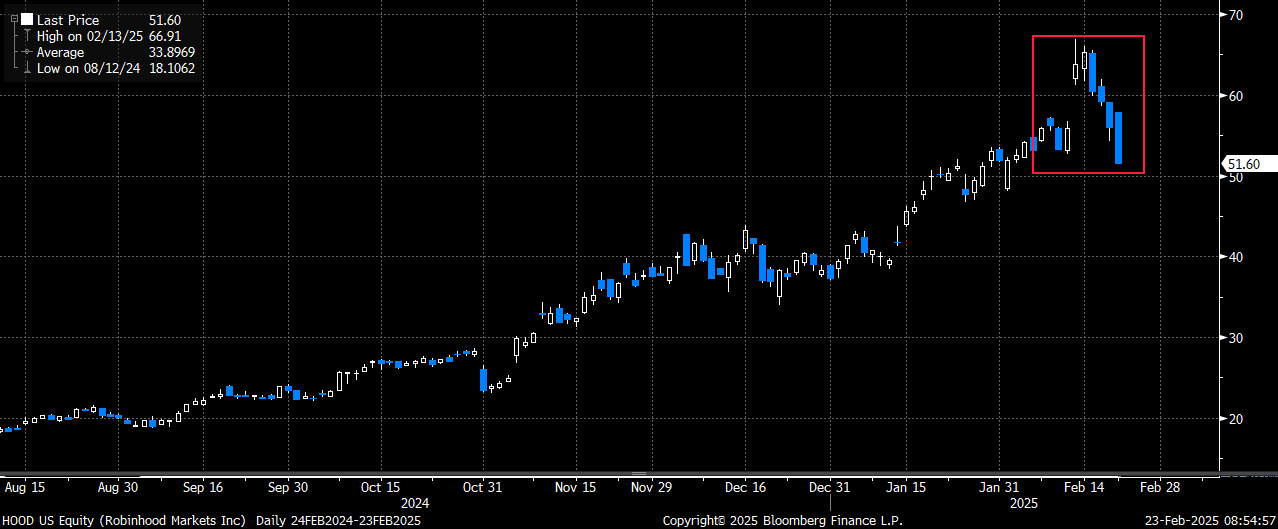
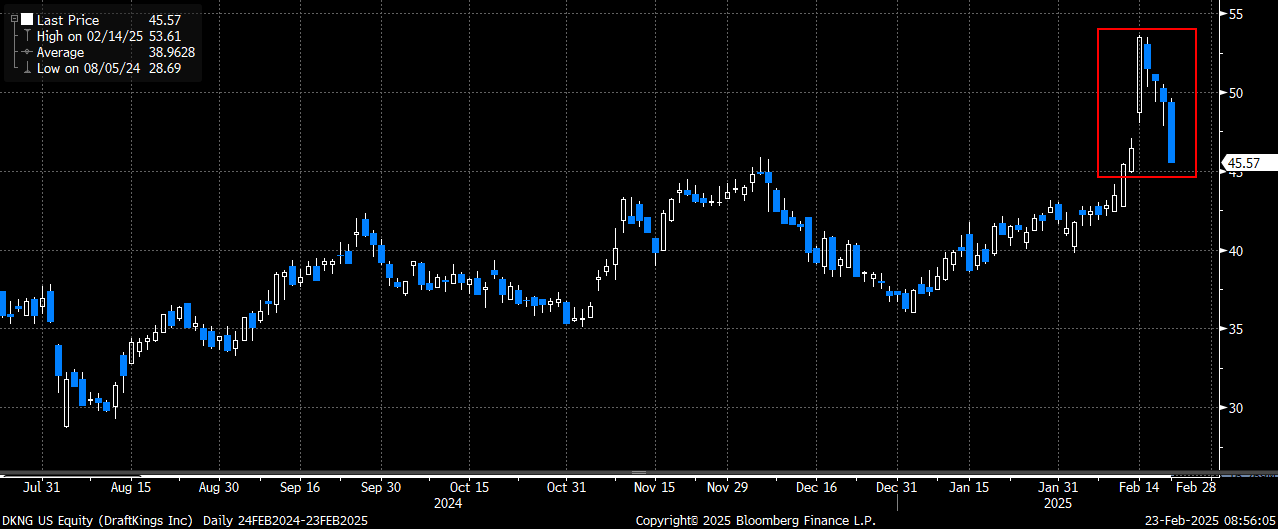
Last week I mentioned that the momentum trade was alive and well. This past week we learned that momentum is a two-way street. In what can only be described as an incredible reversal of fortune, many of the best performing names in the market saw meaningful declines this past week. It wasn’t just that many of these names stopped going up and/or outperforming the market either, but in several cases stocks that had broken out to the upside on earnings ended the week below where they traded before the earnings were announced. Names like Robinhood (HOOD) and DraftKings (DKNG) are great examples for this type of negative action. This negative momentum action also impacted some of the largest companies who reported weeks ago and had seen extremely positive price action since (META, JPM, GS and PLTR all come to mind). META, which had gone up an incredible twenty days in a row, saw its worst week since July with a 7.2% decline and was down every day last week. It is weakness in the larger names that could potentially move the indexes lower from just below their all-time highs.
Robinhood (HOOD) with a very ugly technical reversal last week after jumping higher on earnings the week before
DraftKings (DKNG) with a very similar-type of negative price reaction after a massive earnings spike last week
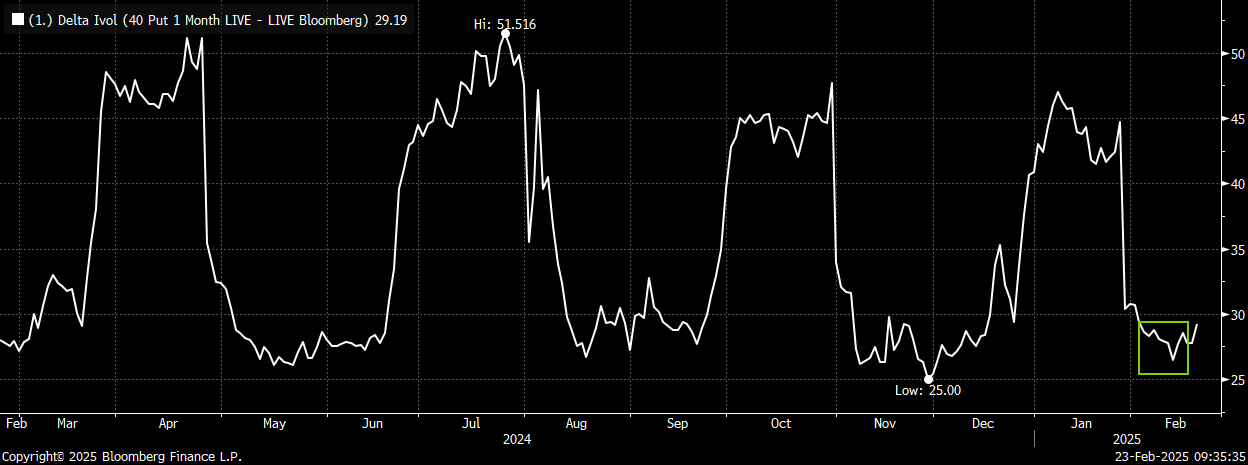
It appears that whatever forces were behind the momentum buying finally decided to cut bait last week. The action again last week exemplifies exactly why owning single-name volatility is extremely attractive in the current environment (something that I continue to stress). META, for example, saw its 1-month 40-delta put vol trading just above the 1-year lows even after it had gone up for three weeks straight. Those puts went up by ~ 200% last week as the stock gave back more than a third of its recent gains (in 4 days). If a company as big as META can see this type of action, it stands to reason that any stock can see large, realized moves, and tactically owning “cheap” protection after large moves higher continues to just make sense.
META shares had a sharp decline last week after rallying for 20 days in a row

META 1-month 40-delta put vol was trading just above the 1-year lows after stock had rallied by more than 20% and gone up for 20 days in a row
As for the market, this negative price action, especially in some of the best performing names, finally took its toll on the main indices by weeks end. We briefly saw both the S&P (SPY) and Nasdaq (QQQ) hit new all-time highs on Wed before declining by over 2% (with most of the damage happening on Friday). If the largest, best performing, names have lost their market leadership for now, it may be hard for the indices to make new meaningful highs in the short-term. In addition, continued weakness in the very names that had lifted the market to new highs could result in some further short-term pain on the index level. This negative price action also comes at a seasonally weak period for the market and ahead of several potentially key catalysts (NVDA earnings 2/26, Feb payrolls 3/7, Feb CPI on 3/12 and PPI on 3/13 and then the FOMC rate decision on 3/19). The market will also have to deal with a potential government shutdown deadline on 3/14 and the looming tariff deadlines on products from Canada and Mexico that were pushed back from early Feb to March. Given the combination of negative price action in the best performing names, coupled with a slew of potentially negative catalysts, I think low-cost index hedges also make sense for the next month. Here are two I would consider using Friday’s closing prices (subject to change):
1) Buy SPY March 590/560 put spread for ~ $4 (SPY 599.94 ref)
- Starts a bit over 1% below spot (after factoring in the $1.65 ex-div on 3/21
- Offers a 6.5x to 1 max payout
2) Buy QQQ March 515/490 put spread for ~ $4.10 (QQQ 526.08 ref)
- Starts 2% below spot and is capped to the downside at the 200-day
- Offers a better than 5x to 1 max payout
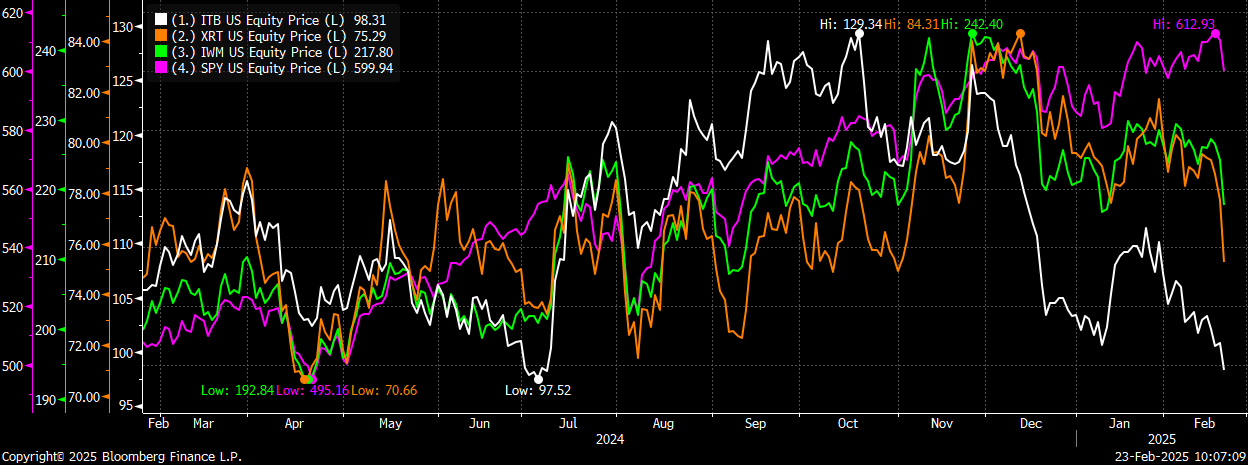
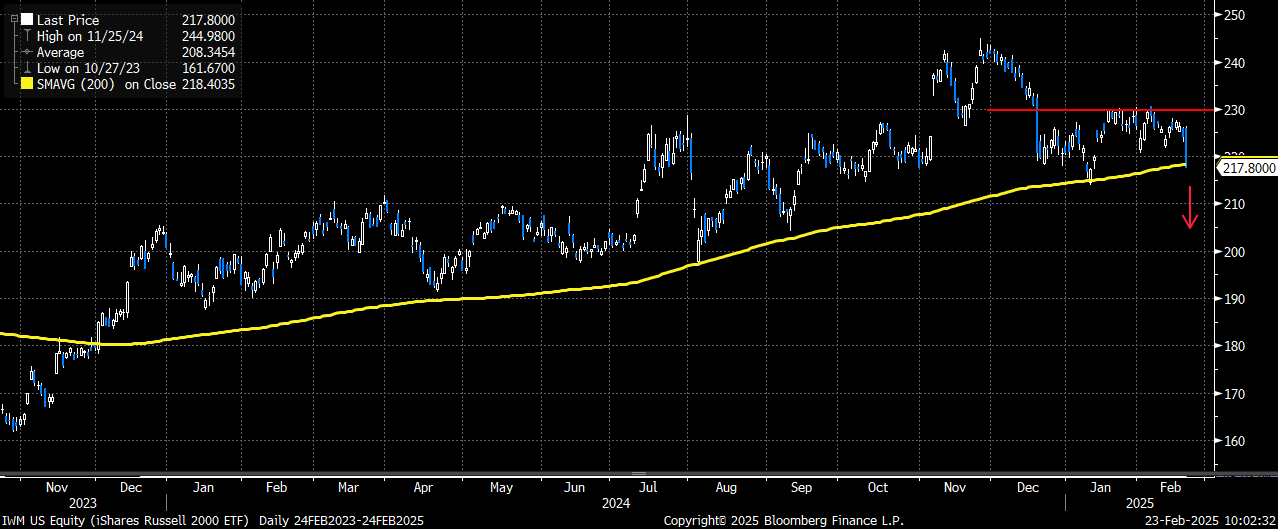
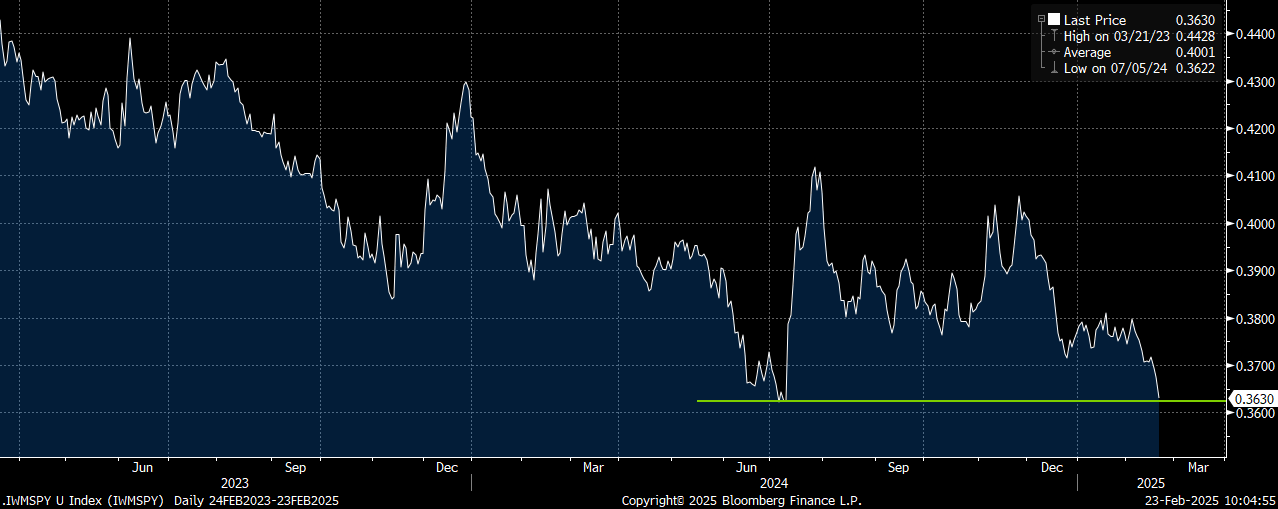
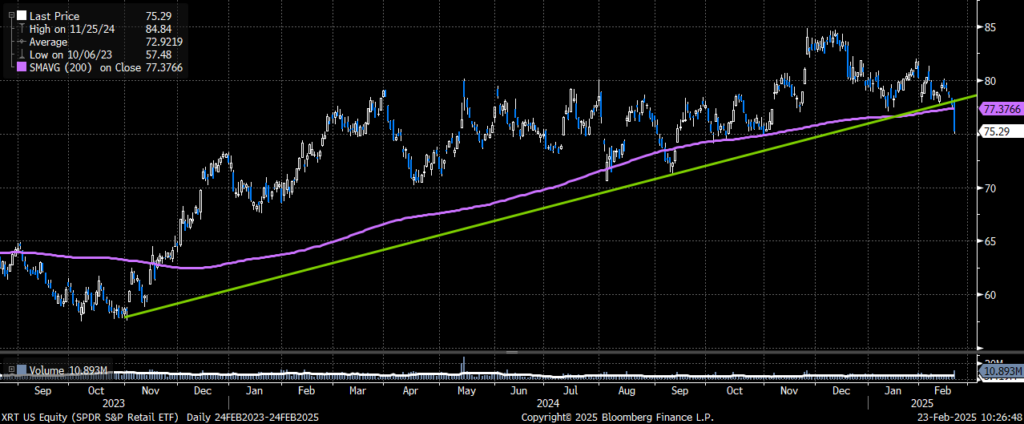
Lastly, I wanted to mention the very poor action in the small caps (IWM). The main small cap etf closed below its 200-day moving on Friday for the first time since December 2023 and the IWM/SPY relative spread is dangerously close to breaking below the July 2024 lows. I mentioned a few weeks ago that the inability for IWM to breakout above clear resistance ~ 230 with the market rallying AND yields moving lower was a potentially negative signal. Now, IWM is not only moving lower on both an absolute (and relative to SPY) basis, but it is also happening as yields continue to move lower. We continue to see real weakness in the consumer related names with the housing trade slumping further and now the main retailer etf (XRT) also breaking below its 200-day support. IWM has a higher correlation to these consumer sectors and if they continue to weaken it doesn’t bode well for IWM (especially given its fragile technical setup). While IWM implied vol continues to trade at a decided premium to both SPY and QQQ, it also has been realizing better on down days (Friday was a perfect example with IWM down 2.9% vs a 2.1% decline for QQQ and a 1.7% drop for SPY). Given this continued negative price action and what appears to be worsening outlook for the consumer, I would also consider adding IWM March hedges here as we approach these key events (especially if exposed to the sector and/or the consumer). Here is a hedge trade I would consider using Friday’s closing prices (also subject to change):
Buy IWM March 213/197 put spread for $2.58 (IWM 217.80 ref)
- Starts 2% below spot (after factoring in the $0.60 ex-div on 3/18
- Trade offers a better than 5x to 1 payout and is capped to the downside at the Aug 2024 lows
Please reach out to me or the trading desk for updated pricing and/or execution capabilities on any of these trade ideas.
IWM closed below 200-day support for the first time since Dec 2023. Inability to breakout above 230 level when market and bonds were rallying was a “tell”
IWM/SPY relative spread just above the July 2024 lows. Wouldn’t surprise me to see new lows established
Main retail etf (XRT) with a break below the November 2023 uptrend as well as 200-day
Housing (ITB), retailers (XRT) and small caps (IWM) all showing large relative weakness to the market (SPY)