Back Economics

More detail on consensus tracking for Core PCE Price Index, as well as some context

Published on February 13, 2025

Download the PDF Report

By

Gerard MacDonell

Before getting into the minutia of my inferences from the informed consensus tracking of the Core PCE Price Index – which looks better post the PPI – I want to make a comment about seasonality, which is much in the news right now.  It is widely believed that there is residual seasonality in the CPI, PPI and thus the PCE Price Index, which tends to make January look quite strong.  But that was not a reason to dismiss the beat in the CPI yesterday, because the seasonal issue was known and there was no major surprise in the revision of the seasonals.  What is much more interesting is that the details from today’s PPI all cut in the benign direction in terms of their implications for the PCE tracking. (h/t Employ America.) So, the core PCE is now looking to be up 27 ½ basis points, please forgive the false precision. And this, despite the notion that the seasonals will lift January on the month.  


Something qualitatively resembling this result was what I had in mind a week ago when I mentioned that the odds were heavily stacked in favor of the 12-month rates of the Core PCE Price Index, my preferred single best measure, and the services super-core version of that all falling meaningfully. As of yesterday, it looked like they were on track to fall, just not meaningfully. But now, they are on track to fall meaningfully. So, my own thinking, which I am careful to update in real time as the news comes in, has roughly made a full circle. 


This month, the 12-month inflation rates are going to fall. And according to the informed bean counters I follow, the 12-month rates can be estimated by just tacking on the consensus estimate for the January gain to the old data through December. And this, despite the fact we will be working with new seasonals. This implies pretty strongly that the short-run growth rates should also be close, for example the 3- and 6-month rates. But in fairness, that result does not follow as a mere matter of pure arithmetic.  It is possible that October gets revised one way and September gets revised exactly the opposite direction, which would mean the simple extrapolation for the 12-month rate would work (which it will), while that for the 3-month rate would not.  But this is a very minor point. 

Ok, with that as context. My regular slicing and dicing of the informed consensus, as I read it so far (we get import prices tomorrow), is in the table above, which this month includes actual for December, so you can see precisely how the various inflation rates will evolve. 

Compare the January with the December 12-month rates to keep it simple


Source: BEA, FH calculations and inferences
Data are actual to December and estimates for January. 

 And the chart below shows a history of the core PCE Price Index and my single-best measure through January. Keep in mind that the single best measure strips out some unhelpful sources of noise, but at the cost of introducing a (hopefully stable) downward bias of about 20 bps (ar). So, think of the 12-month rate there, of 1.8%, as implying underlying inflation, according to this measure, of about 2%. Keep in mind also that the single best measure just happens to spot all the benefit of the doubt to the doves in the current context. So, while this is the single best measure, it is not inconsistent with the notion that underlying inflation is still a bit high, just not very.

12-month rates on track to take a new leg lower, as expected — a week ago.
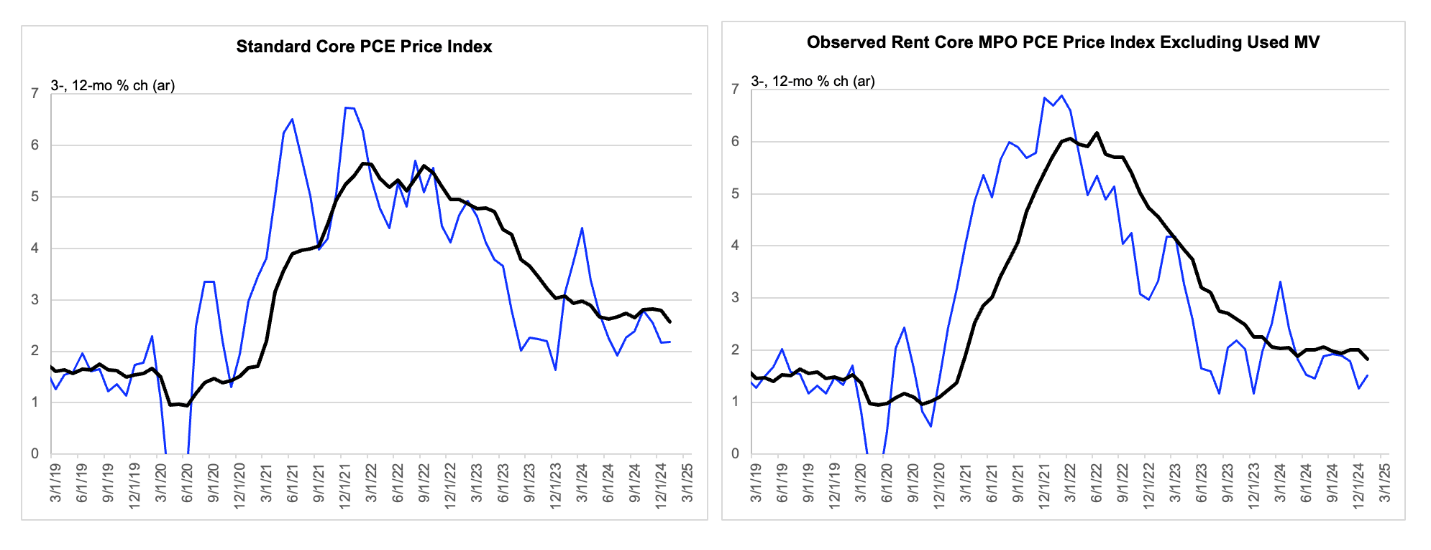

Source: BEA, FH calculations and inferences
Data are actual to December and estimates for January. 

Separately, and distantly secondarily, the sectoral mix within the single best measure looks benign. For any given rate of inflation in the single best measure, it is probably better that more come from goods and less from services, because the latter is stickier and more closely linked to the domestic business cycle.  Trump raising tariffs will not help on the goods side, but that is a separate – and important – discussion. Right here, I am just describing the current situation. And it is possible that anticipation of tariffs might have artificially lifted trailing goods price inflation anyway, which would reinforce my point about how the mix is at the margin benign. 

This mix is better than the opposite would be
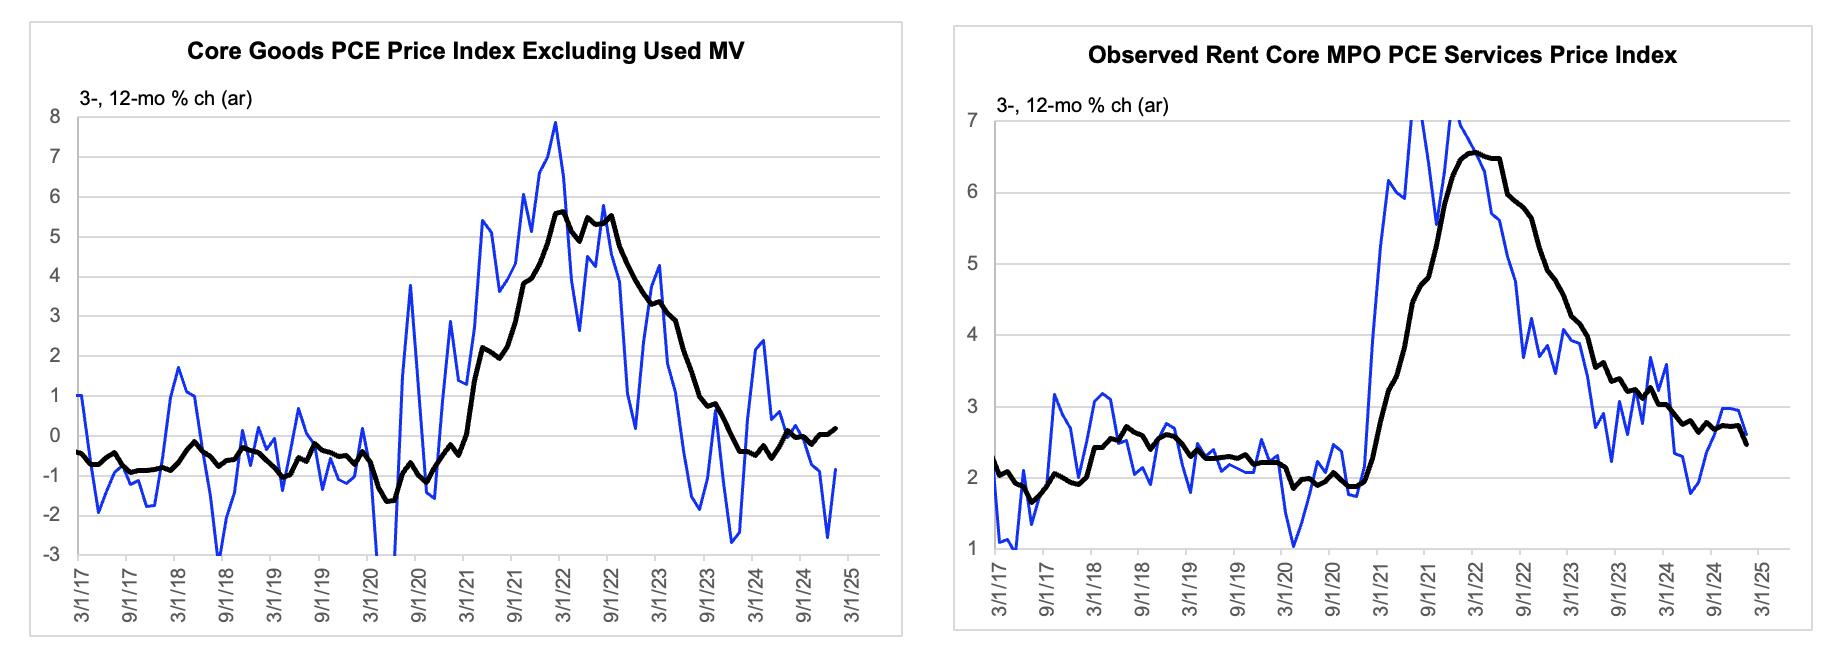

Source: BEA, FH calculations and inferences
Data are actual to December and estimates for January. 

DISCLOSURES AND DISCLAIMERS

Analyst Certification

The analyst, 22V Research Group, primarily responsible for the preparation of this research report attests to the following: (1) that the views and opinions rendered in this research report reflect his or her personal views about the subject companies or issuers; and (2) that no part of the research analyst’s compensation was, is, or will be directly related to the specific recommendations or views in this research report.

Analyst Certifications and Independence of Research.

Each of the 22V Research analysts whose names appear on the front page of this report hereby certify that all the views expressed in this Report accurately reflect our personal views about any and all of the subject securities or issuers and that no part of our compensation was, is, or will be, directly or indirectly, related to the specific recommendations or views of in this Report.

22V Research (the “Company”) is an independent research provider. The Company is not a member of the FINRA or the SIPC and is not a registered broker dealer or investment adviser. 22V Research has no other regulated or unregulated business activities which conflict with its provision of independent research.

22V Research, LLC is a professional services and independent publication organization. 22V Research, LLC is not a securities broker-dealer, not a member of the Financial Industry Regulatory Authority (FINRA), not a registered investment advisor (RIA) and not a member of SIPC.

Securities transactions, when offered, are offered by 22V Securities, LLC through LPS Capital, LLC. Certain employees of 22V Securities, LLC are dually registered as securities representatives of LPS Capital, LLC or Analyst Hub Securities, LLC. 22V Securities, LPS Capital and Analyst Hub Securities are members FINRA, SIPC.

https://brokercheck.finra.org/

Current Ratings Definition.

SECTOR OUTPERFORM: An “outperform” rating anticipates the company will outperform the S&P Regional Banking Index (peer group).

SECTOR PERFORM: A “market perform” rating anticipates the company will perform in line with the S&P Regional Banking Index (peer group).

SECTOR UNDERPERFORM: An “underperform” rating anticipates the company will underperform the S&P Regional Banking Index (peer group).

Limitation Of Research And Information.

This Report has been prepared for distribution to only qualified institutional or professional clients of 22V Research Group. The contents of this Report represent the views, opinions, and analyses of its authors. The information contained herein does not constitute financial, legal, tax or any other advice. All third-party data presented herein were obtained from publicly available sources which are believed to be reliable; however, the Company makes no warranty, express or implied, concerning the accuracy or completeness of such information. In no event shall the Company be responsible or liable for the correctness of, or update to, any such material or for any damage or lost opportunities resulting from use of this data. Nothing contained in this Report or any distribution by the Company should be construed as any offer to sell, or any solicitation of an offer to buy, any security or investment. Any research or other material received should not be construed as individualized investment advice. Investment decisions should be made as part of an overall portfolio strategy and you should consult with a professional financial advisor, legal and tax advisor prior to making any investment decision. 22V Research Group shall not be liable for any direct or indirect, incidental or consequential loss or damage (including loss of profits, revenue or goodwill) arising from any investment decisions based on information or research obtained from 22V Research Group.

Reproduction And Distribution Strictly Prohibited.

No user of this Report may reproduce, modify, copy, distribute, sell, resell, transmit, transfer, license, assign or publish the Report itself or any information contained therein. Notwithstanding the foregoing, clients with access to working models are permitted to alter or modify the information contained therein, provided that it is solely for such client’s own use. This Report is not intended to be available or distributed for any purpose that would be deemed unlawful or otherwise prohibited by any local, state, national or international laws or regulations or would otherwise subject the Company to registration or regulation of any kind within such jurisdiction.

Copyrights, Trademarks, Intellectual Property.

22V Research Group, and any logos or marks included in this Report are proprietary materials. The use of such terms and logos and marks without the express written consent of 22V Research Group is strictly prohibited. The copyright in the pages or in the screens of the Report, and in the information and material therein, is proprietary material owned by 22V Research Group unless otherwise indicated. The unauthorized use of any material on this Report may violate numerous statutes, regulations and laws, including, but not limited to, copyright, trademark, trade secret or patent laws.
