Market volatility appears here to stay
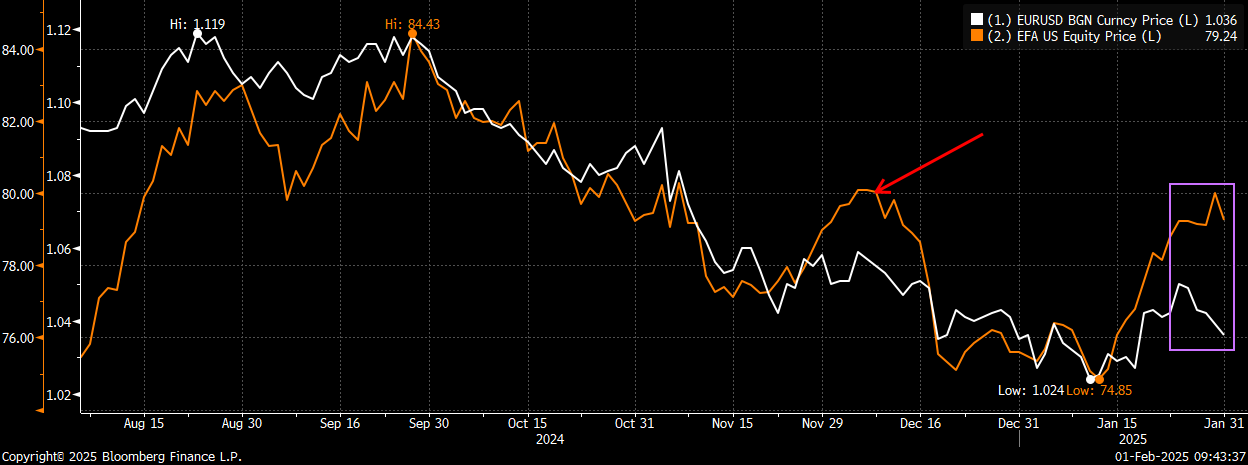
Last week was a very interesting week for both the markets and volatility. We started the week with the Deepseek news which led to a large spike in vol (VIX), and after markets had calmed down and digested that news we ended the week with the tariff news and further questions as to where both markets and vol are now headed. The one thing that certainly stood out to me was how many 1% moves we saw in the main index (SPY), especially in an environment where VIX remains towards the low-end of its recent range. Starting with the sharp drop on the open last Monday, we saw 8 moves of about 1% (both higher and lower) in the five trading days last week. This is just unprecedented volatility for an environment where VIX remains ~ 15-16. It also reinforces my belief that you want to be long vol here, whether as a hedge or as a way to define your risk.
Last week there were eight 1% moves in SPY in just five trading days (4 up moves and 4 down moves)
10-year yields at a key level
I believe the 10-year yield bears watching here as it is sitting at a very critical technical level. Following the breakout in yields in early January to fresh 1-year highs, we have seen bonds rally and the 10-year yield has moved back down from a high ~ 4.81% to a current 4.57%. What is of note is the pullback in yields was right to the December breakout level, the 50-day moving average and the September uptrend support. This action is VERY similar to the pullback we saw in yields from mid-November into early December, before we saw a sharp spike in yields after bouncing off similar support. Should we see yields move back higher, this could have negative implications for many of the equity sectors that have rallied ever since yields peaked in early January. Given the tariff concerns, as well as upcoming economic data (Jan payrolls on 2/7 and then CPI on 2/12) we certainly can expect more volatility in rates over the next few weeks.
10-year yields at a key technical level once again. Current setup looks a lot like the December pullback before yields spiked again to new highs

Two tactical equity option trades to consider as a hedge against a possible move back higher in yields
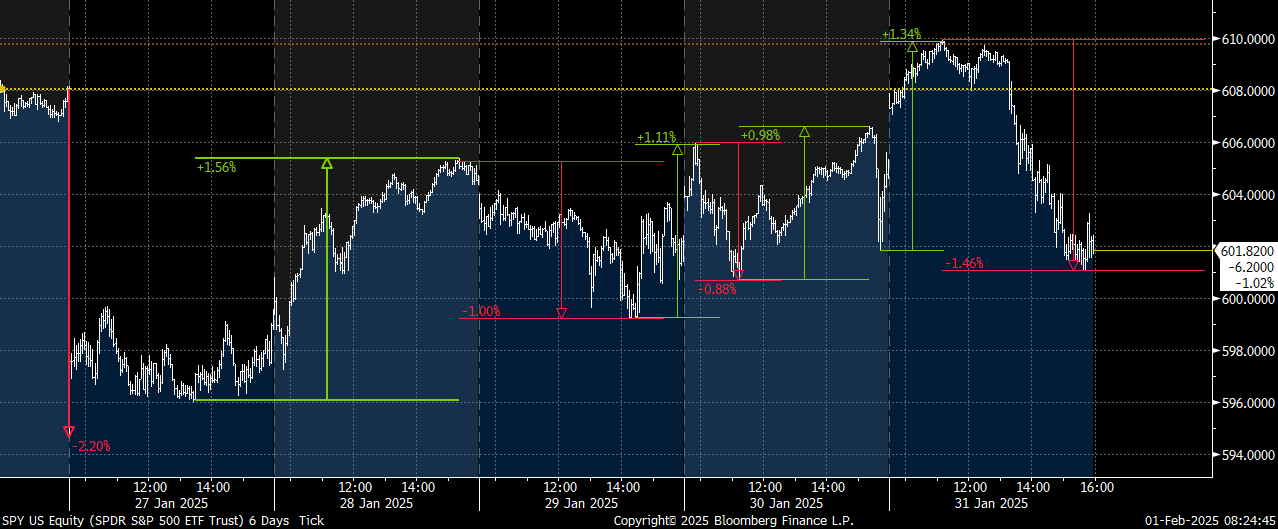
The first trade I want to highlight is in small caps (IWM). Small caps generally underperform as yields rise given the negative impact higher rates typically have on their funding costs. After rallying back to the all-time highs after the election, we saw a sharp pullback of ~ 12% as yields moved higher between early December and early January. While IWM has been able to rebound off the January lows as yields moved lower, it has been unable to breakout above the well-defined resistance area ~ 230 (50-day moving average and level it broke down below on the December FOMC meeting). What also concerned me about IWM was that on Monday, when bonds were rallying sharply on the Deepseek “risk-off” trade, IWM also dropped by 1% (almost as much as what SPY declined by). The inability for IWM to breakout above this 230 area while yields have been declining doesn’t bode well for the sector should we see another move back higher in yields. We saw a glimpse of this late Friday as 10-year yields moved from ~ 4.51% to 4.57% on the tariff headlines and IWM quickly dropped from 230 down to ~ 226.
Against this backdrop, implied volatility in IWM puts remains just above the recent lows ~ 22. Given the risk of further weakness should yields move higher, I think buying IWM Feb puts just below the well-defined 230 resistance area makes a lot of sense (especially ahead of the key economic data we have upcoming as well). IWM declined by 2.2% on the “stronger” lobs report in January, and then rebounded by ~ 2% when the “softer” CPI report came out the next week. Clearly, IWM can and will move sharply off these data points. So with implied volatility still low, I like the risk/reward of owning puts outright here as a trade.
Trade:
Buy IWM Feb 222 puts for ~ $2.75 (IWM 226.48 ref)
Trade Details:
- Buying the Feb 33-delta puts with 10-year yields at a key level and IWM unable to move above clear resistance
- IWM tends to trade inversely to yields (saw a 12% decline from late November thru mid-January as yields moved higher)
- 222 level is just below the “new” short-term support ~ 223 and would signal a change in price action
- Tariffs and potential for stronger jobs/CPI data could both be the catalyst for yields moving higher and IWM likely moving back lower
- IWM put vol up a bit off the recent lows, but still near the lower-end of the recent range
- Continue to favor owning vol in a tape where we see a lot of day to day volatility (IWM had roughly thirteen 1% moves in the five trading days last week)
- Puts can be bought as a hedge to small caps, a hedge to yields moving higher, or just an outright bearish bet with limited risk
IWM chart – after rallying to the old highs in Nov we saw a 12% decline as yields moved higher. Has been unable to clear 230 on recent rally with rates down
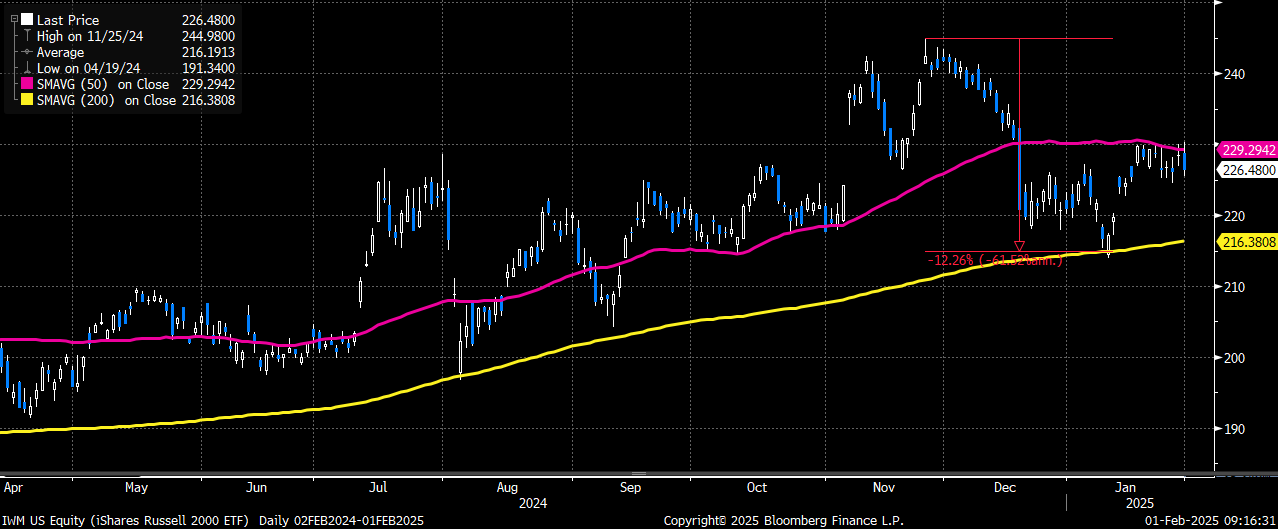
IWM 1-month (Feb) put implied volatility is still near the recent lows
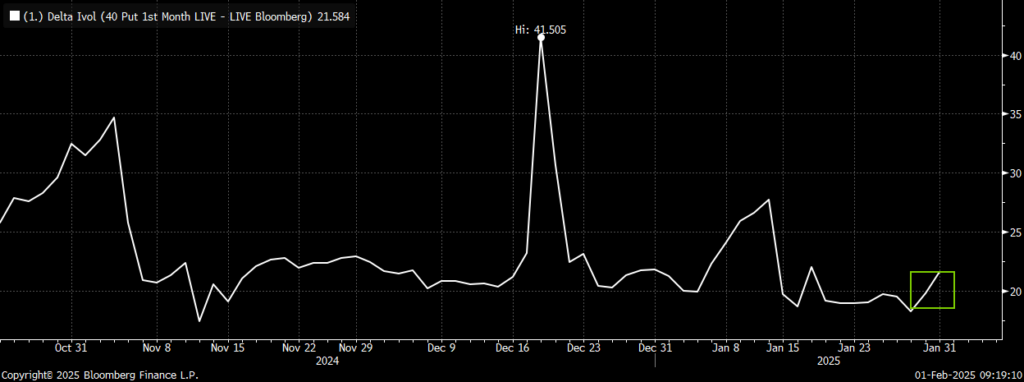
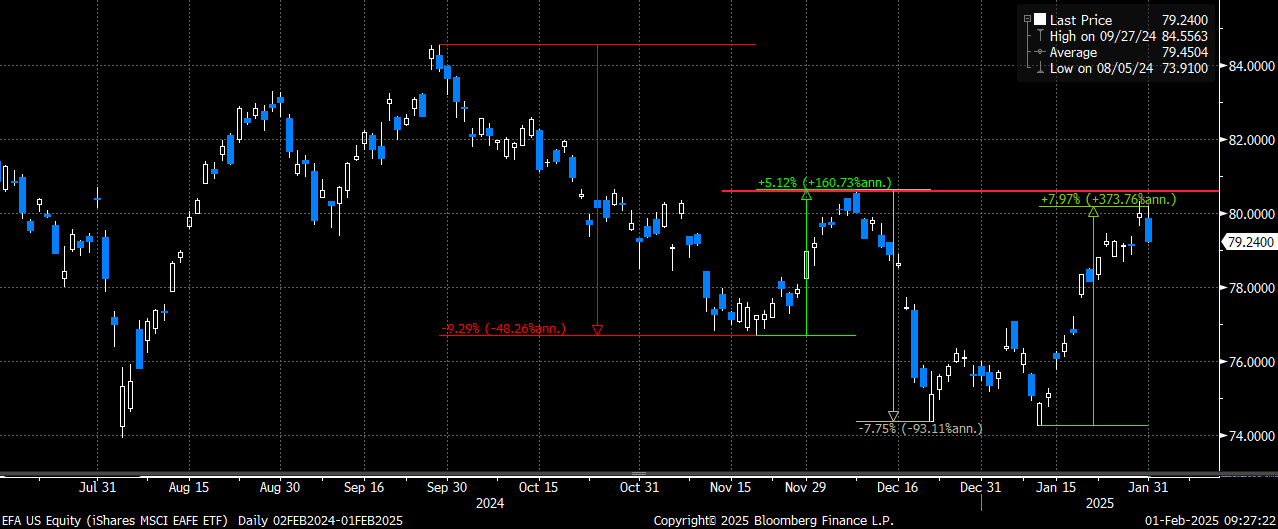
The second trade I want to highlight is in EFA. Much like IWM, EFA has rebounded off the January lows and is also sitting just below what should be resistance (December highs ~ 80.50). EFA has also seen its fair share of volatility as it has now had four moves of at least 5% just since the end of September, with the average move being ~ 7.5%. Even with these sharp moves, both up and down, EFA 1-month (Feb) put vol remains “cheap” as it trades ~ 13. Because EFA is heavily concentrated with European holdings, it tends to trade very closely to moves in the Euro/$ forex spread. After a brief bounce, it appears the Euro is now poised to possibly make new lows vs the US$ once again. A move back higher in yields should certainly expedite the Euro weakening vs the $, especially as the ECB cut rates this week. In addition, Trump has already said he plans to impose tariffs on the EU, which could also further weaken the Euro vs the Dollar. EFA is already trading “rich” relative to the Euro/$ spread it has tracked so well, so we could see a quick “catch-up” trade lower in EFA if the Euro continues to weaken (whether on higher yields in the US, and/or on EU tariff concerns). The last time EFA traded at this wide a spread to the Euro/$ spread was in early December, and then we saw EFA drop by ~ 8% in about two weeks.
Trade:
Buy EFA Feb 78.5 puts for ~ $0.60 (EFA 79.24 ref)
Trade Details:
- Buying the 1% out of the money EFA puts following 8% rally off the Jan lows back to the December highs
- EFA tends to track Euro/$ spread very closely, and is already trading “rich” to that spread
- Could see Euro weaken further to the Dollar should we see higher yields in the US and/or on Trump EU tariffs
- EFA has already had 4 large moves since the start of October (7.75% average move), yet implied vol continues to trade fair to cheap
- Puts can be bought as a hedge to European equities, a long Euro position, or as a hedge to higher US interest rates
- Also favor buying puts outright here given the very attractive setup
Please contact me or the 22V trading desk for updated prices and/or execution capabilities for either trade idea
EFA just rallied ~ 8% off the Jan lows right back to the December highs. There have now been four moves of 5%+ in EFA just since October
EFA (orange) tends to track the Euro/$ spread (white) very closely. Now trading at widest spread since December (EFA dropped 8% shortly after)