

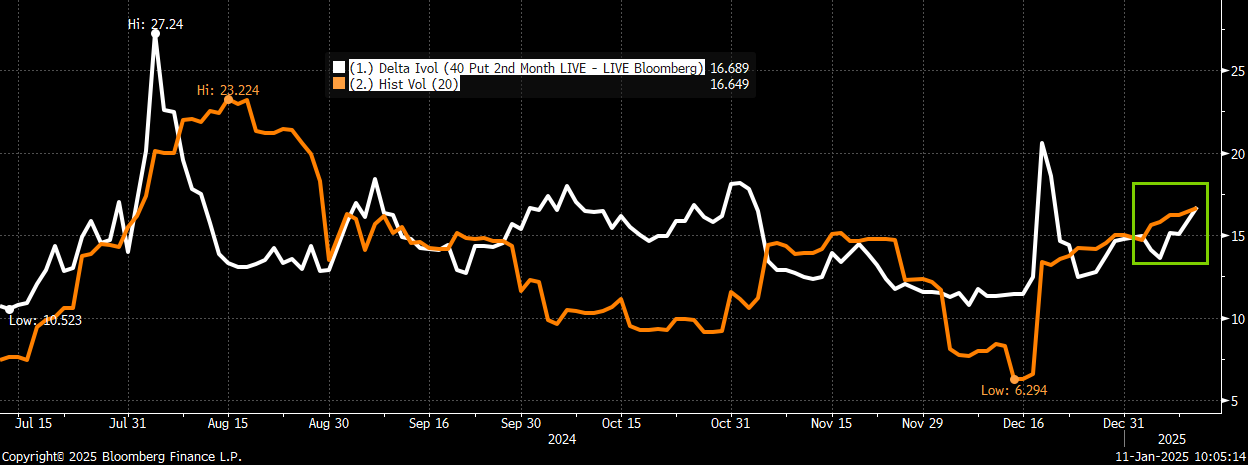
Higher volatility remained a theme this week as we saw three of the four trading days have realized moves of 58bps or more. The two days that had key economic data (ISM on Tuesday and payrolls on Friday), that I highlighted last week as possible negative catalysts for both bonds and stocks, saw declines of 1.13% and 1.53% respectfully. Even with the move higher in implied volatility we have seen off the Dec lows, it still is only trading right in-line with where 20-day realized volatility trades.
Feb 40-delta put implied vol is still only trading at the same level as 20-day realized vol and is still below the December highs
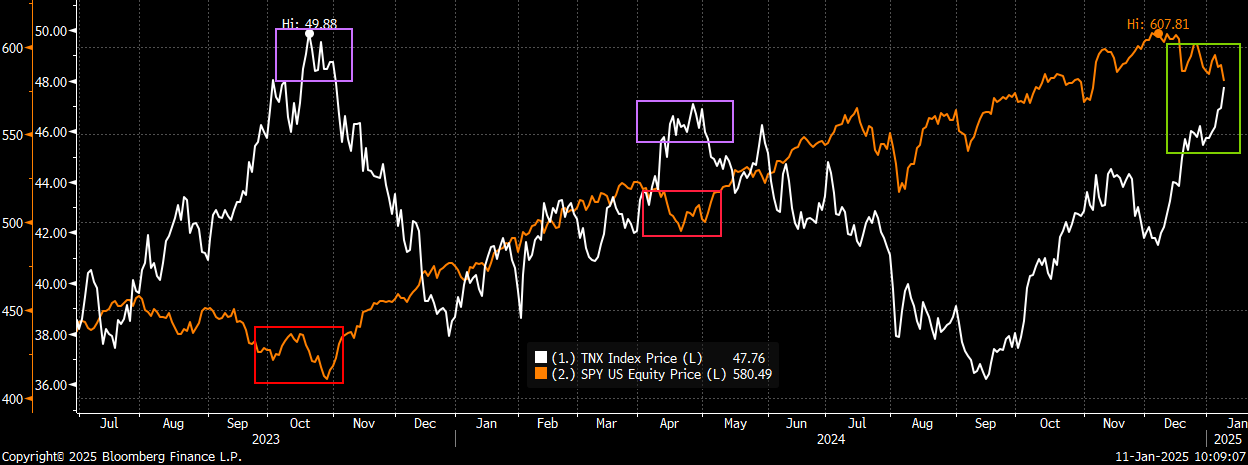
Higher rates continue to put pressure on stocks as the 10-year yield closed at a 14-month high ~ 4.78%. The move in yields not only continues to put pressure on the more interest-rate sensitive sectors of the market, but now we are starting to see weakness in several of the growth/tech names as well. As I have been saying, the spread between where SPY and QQQ are trading versus where yields are seems unsustainable given where they traded relative to rates the last two times yields were at these elevated levels (October ’23 and April ’24).
10-year yields (white) hit a 14-month high on Friday. SPY (orange) was still considerably lower the last 2x yields were here
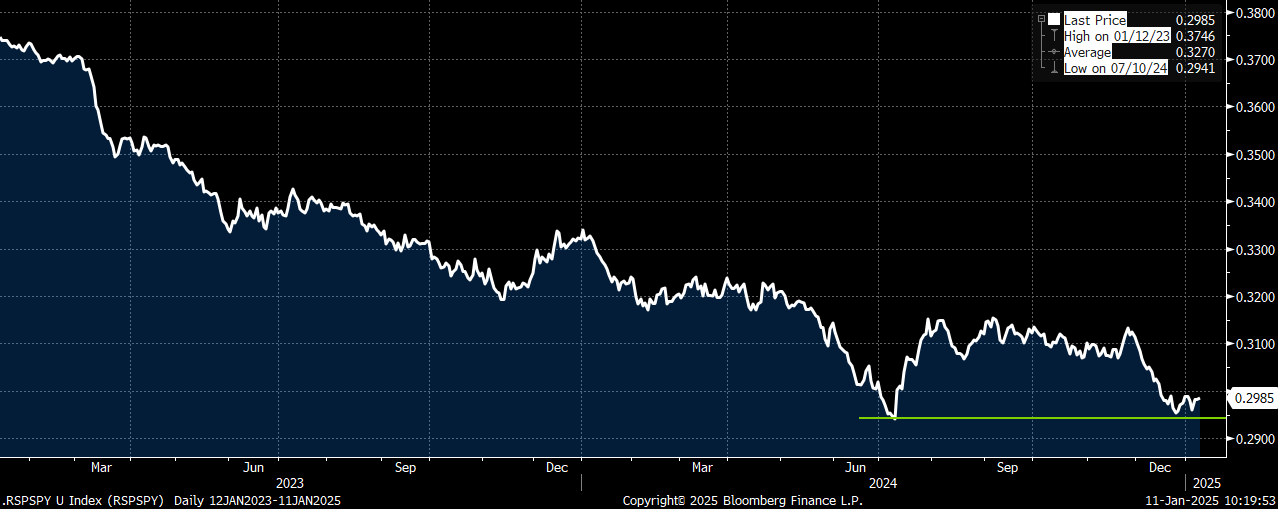
What should also be a concern for investors in the main index (SPY) is that even after the move higher in yields off the September lows, and the weakness we have already seen in the more defensive/interest-rate sensitive areas of the market, is that those sectors continue to still move decidedly lower on days like Friday when we got a hotter payroll report (staples, reits, banks and small caps were all noticeable laggards). In fact, the equal-weighted index (RSP) was down roughly the same as SPY and QQQ on Friday even though the RSP/SPY relative spread is at the lows. In the past, when we had seen tech weakness, there had been a rotation out of tech to other areas of the market. Should we continue to see this weakness in the already battered/underperforming groups, and also see the selling in tech pickup, it seems inevitable that SPY will break lower (especially given the high tech weighting) and play “catch-up”.
If yields stay here (or go higher) we should start to see SPY/QQQ play “catch-up” to the weaker small caps (IWM) and equal-weight (RSP) sectors

The RSP/SPY relative spread back to the lows. Could see it move back higher with SPY trading down (led lower by tech) given massive outperformance
Given this backdrop of higher yields, very poor market breadth and implied vol only now trading in-line with realized vol, I continue to favor owning Feb puts as a way to hedge overall market risk. That being said, I prefer to buy or add puts/hedges on market rallies rather than on days when the market is weak (like Friday), I still prefer owning puts outright for now over put spreads as put skew remains at/near the recent lows. We still have a lot of potential catalysts both on the economic calendar (CPI/PPI this week, followed by FOMC meeting and PCE later in the month) as well as a slew of high-profile earnings that could not only add further volatility, but could finally move SPY down to where the more rate sensitive sectors like IWM and RSP are trading.
As far as which February puts I would look to buy (especially on any rallies) I would now suggest the following:
BUY SPY Feb 575 Puts – targeting a break below the recent support area ~ 580 which would also represent a “failed” breakout off the election rally
Continue to believe higher rates put a cap on SPY ~ 600 with a good chance we see a break below 580 support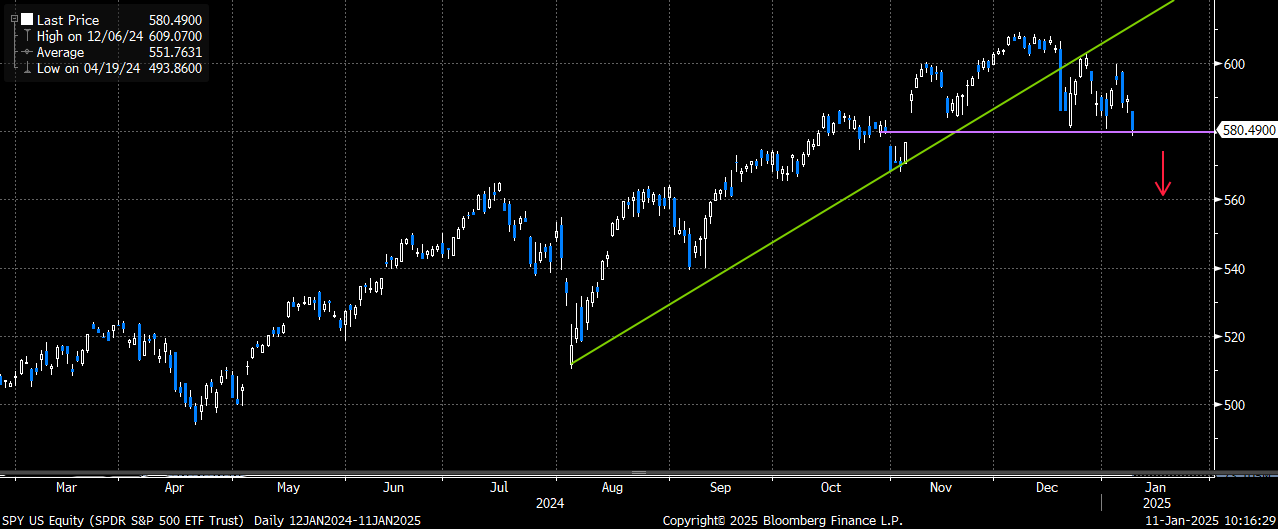
Other tech-specific hedges to consider ahead of earnings season:
With higher rates finally starting to impact the tech/growth trade, I wanted to highlight two sector ETF’s that I believe could be good ways to hedge exposure to either the tech trade and/or to the top-weighted names in the ETF.
Trade #1:
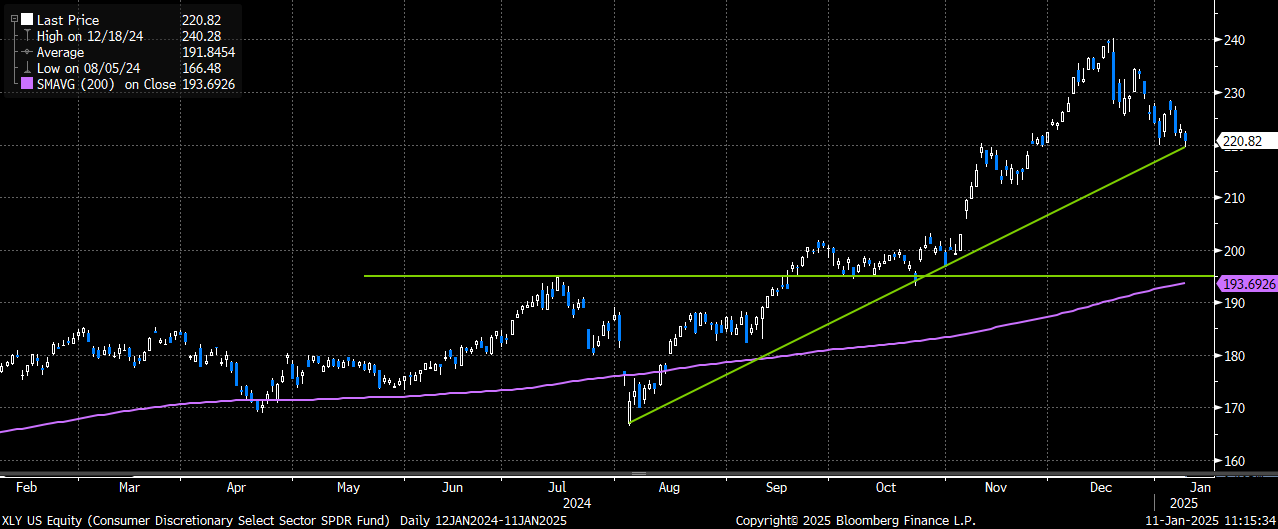
Buy XLY Feb 215/195 put spread for ~ $3 (XLY 220.82 ref)
Trade Details:
- Buying the XLY Feb put spread that starts 2.6% below spot
- Feb structure captures earnings for several of the top-weighted names (specifically AMZN and TSLA)
- Trade offers a 5.7x to 1 max payoff
- Targeting a potential break below the August uptrend support with put spread capped down at the July breakout and 200-day moving average
- Put spread could be bought as either a macro tech/consumer hedge, or as a limited-risk bearish bet given attractive setup.
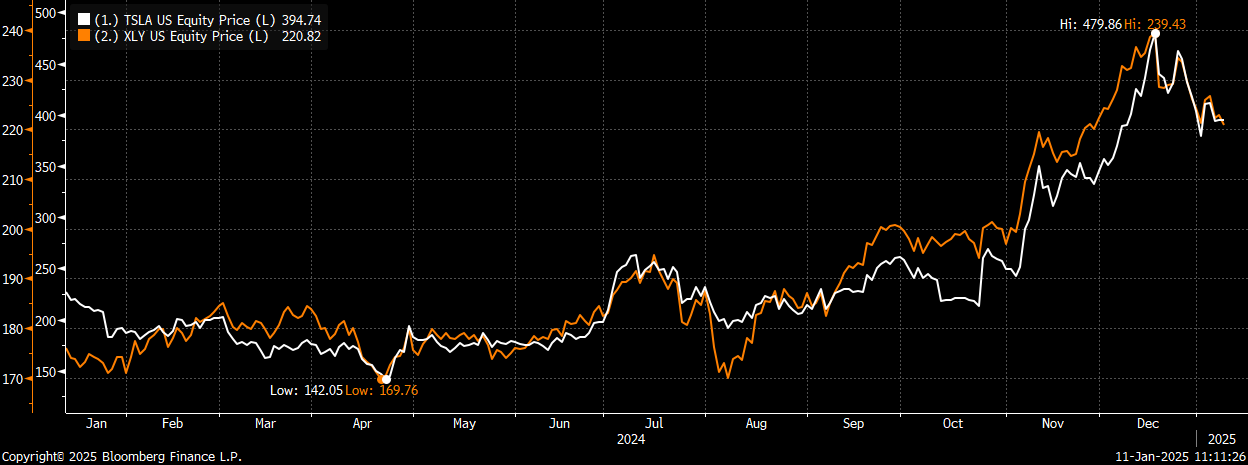
Even though XLY is the consumer discretionary ETF, it really is more of a tech trade as the top-2 weightings (AMZN @ 21% and TSLA @ 18%) make up nearly 40% of the entire ETF. The strength in TSLA off the election results had a very positive impact on XLY as we not only saw a 22% gain from the November lows to the December highs, but we saw XLY outperform both QQQ and SPY by a wide margin as well. TSLA will report earnings on 1/29, and it has become one of the most volatile tech movers on earnings as of late. TSLA has averaged a 12.3% move on earnings over the last 8 quarters, with no move being less than 9.3%. XLY has averaged a 2.4% 1-day move on the last eight TSLA reports. TSLA implied vol has moved up in Feb and it currently trades ~ 65. XLY vol for Feb remains in the low 20’s and with an 18% weight it has the largest exposure to TSLA of any main (liquid) etf (even more than ARKK which has a 14.3% weight in TSLA). TSLA rallied by 130% from the Oct lows to the Dec highs (let that sink in for a minute) and has since come in by ~ 20% after deliveries missed and the market has pulled back on higher rates. Given the massive move higher we saw in TSLA it wouldn’t be a surprise to a further pullback (especially if rates continue to put pressure on stocks with higher multiples). Clearly, as the TSLA trade goes then XLY is likely to follow.
AMZN will also report at the end of Jan/early Feb and it too has seen some outsized moves on earnings as of late. Over the last six reports, AMZN has averaged a 6.7% 1-day move with only 1 move being less than 6.2%. Again, XLY has a 21% weighting in AMZN and any weakness there should likely impact XLY negatively as well.
The outperformance by XLY, coupled with having large exposure to two stocks that continue to have large realized moves on earnings, makes owning XLY hedges an attractive proposition at this time in my opinion.
XLY rallied 22% from the Nov lows to the Dec highs and is not sitting right on potential support. Targeting a potential break and a move back to support ~ 195
As TSLA (white) goes so goes XLY (orange). XLY offers a “cheaper” way to play TSLA thru earnings as well as having exposure to other tech/consumer names
Trade #2:
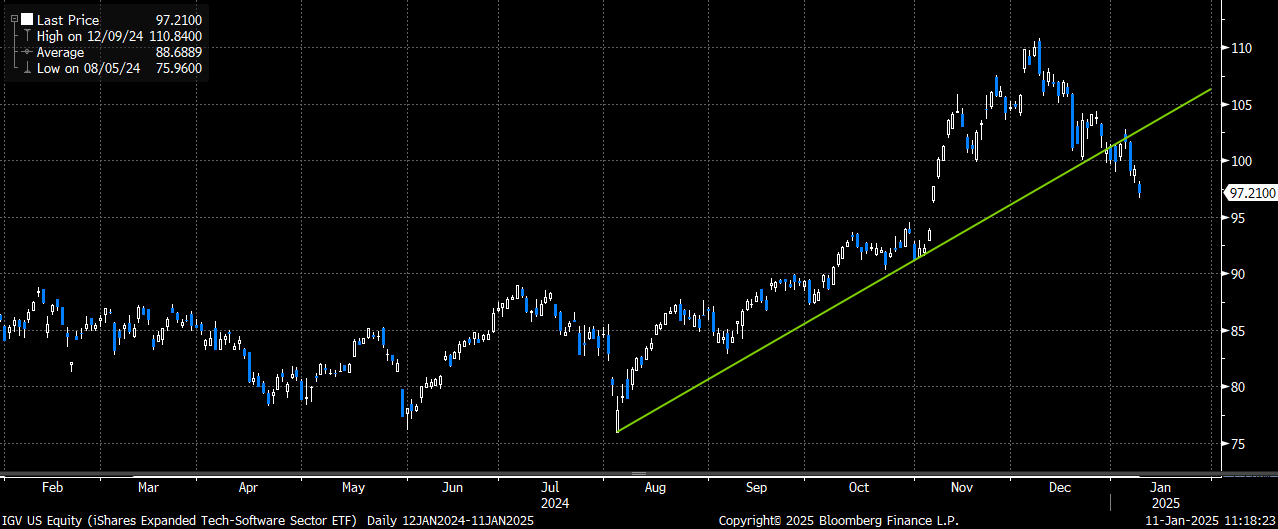
Buy IGV Feb 95/85 put spread for ~ $1.75 (IGV 97.21 ref)
Trade Details:
- Buying the IGV (software) Feb put spread that starts 2.3% below spot
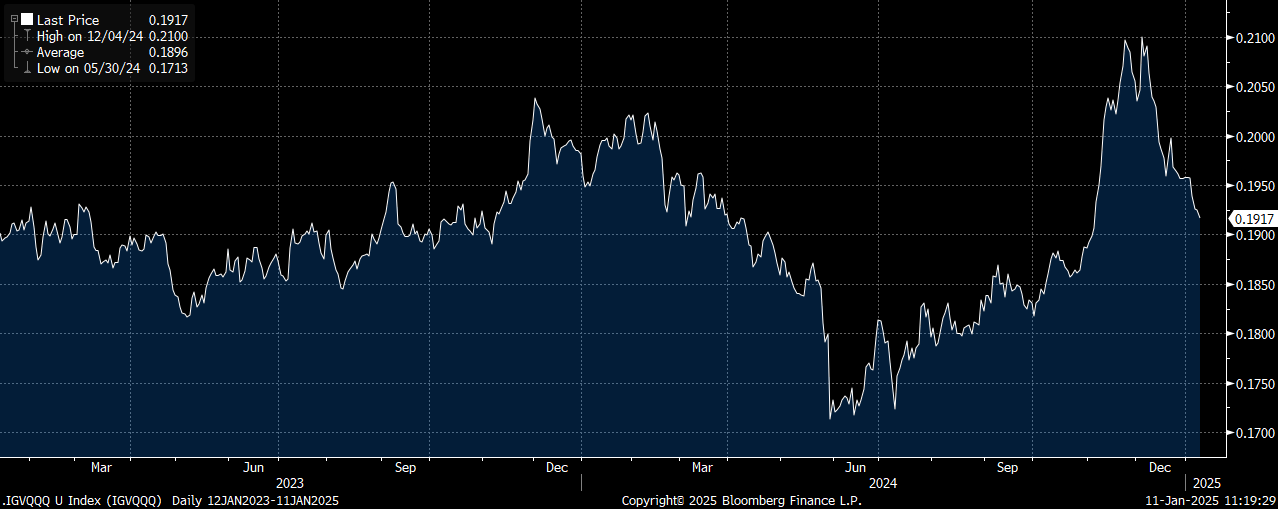
- Software led tech higher (especially in November as parts of the semi trade came undone) but has since been a major laggard
- We have already seen some negative reactions on recent earnings in the sector over the last few months (ADBE, MSFT, ORCL and INTU)
- Perhaps high multiples and large forex exposure could be negatively impacting the sector?
- Trade offers a nearly 5x to 1 max payoff at expiration
IGV has already broken below the August uptrend support
The IGV/QQQ spread had a large move higher (especially in November) and is now once again moving lower as software continues to underperform
Please contact me or the trading desk for updated pricing and execution capabilities on any of the above trades.

