

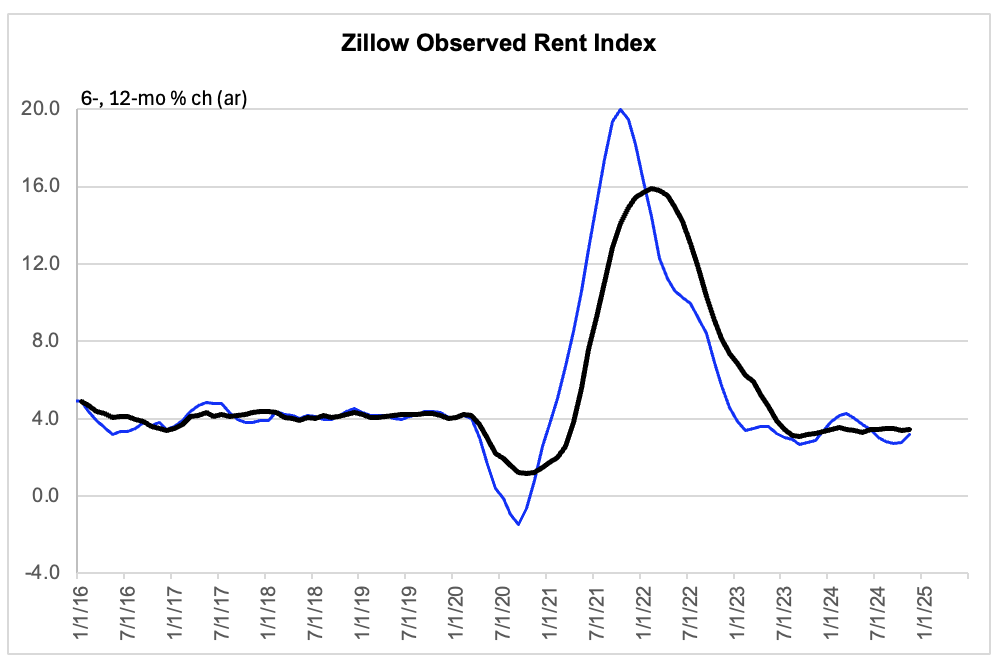
Zillow updated their Observed Rent Index (ZORI) last week, while we were focused on the CPI, PPI and their implications for the PCE Price Index. Using their seasonal adjustment, which may be imperfect, the ZORI was up 35 basis points or at an annualized rate of 4.3% in November. This allowed the 3-, 6-, and 12-month rates all to be in a range of 3.2 — 3.5%.
Source: Bloomberg, FH calculations
Data are actual to November.
I follow the ZORI because — among other things — research from the Cleveland Fed and BLS suggest that it is an ok measure of marginal rent growth and because the data are readily available to me in electronic form. However, it is probably wise to cross-check the signal from the ZORI with the trend in CoreLogic’s Single Family Rent Index (SFRI). That same research from the Cleveland Fed and BLS suggests that the SFRI may be the best measure of marginal rent inflation in real time, when the BLS’s own experimental measure of marginal rent growth, the NTRI, is heavily subject to revision. I am not really sure that the research is correct, because it does not check for error correction and because I do not have access to the SFRI to do my own statistical work, thank god! 🙂 But it seems prudent to watch both measures (and other measures as well) and to make a good enough for government work subjective assessment.
Recently, the SFRI has shown a marked tendency to decelerate, as indicated in CoreLogic’s late November report, which presents data through September, although without making it available in electronic form. Unlike the ZORI, the SFRI is not smoothed to a 3-month moving average before publication, so the 12-month rate depicted to September is directly comparable with the ZORI to October. In other words, the SFRI is currently lagging by a month in practical terms, although this will be corrected sometime in the coming week, when we are due for an update from CoreLogic.
The point is that these two metrics are currently giving a slightly and newly different take on what is going on with marginal rents. For now, I will continue to split the difference and go with my subjective assessment that marginal rent growth is running at an annualized rate of 2 1/2% sequentially. The ZORI says higher and the SFRI says lower, especially when we factor in that the SFRI is for single-family structures only. If I am off by 50 bps on my subjective assessment it is no big deal, because the implication for what I call “Observed Rent” versions of the various slices of the PCE Price Index would not be affected much, given that “housing” has a weight of only 17 1/2% in the Core PCE Price Index. The larger issue is whether we should even be using some subjective estimate of marginal rents, rather than the trailing government measures of average rents, when assessing the underlying trend of inflation. I pick yes, as you know.
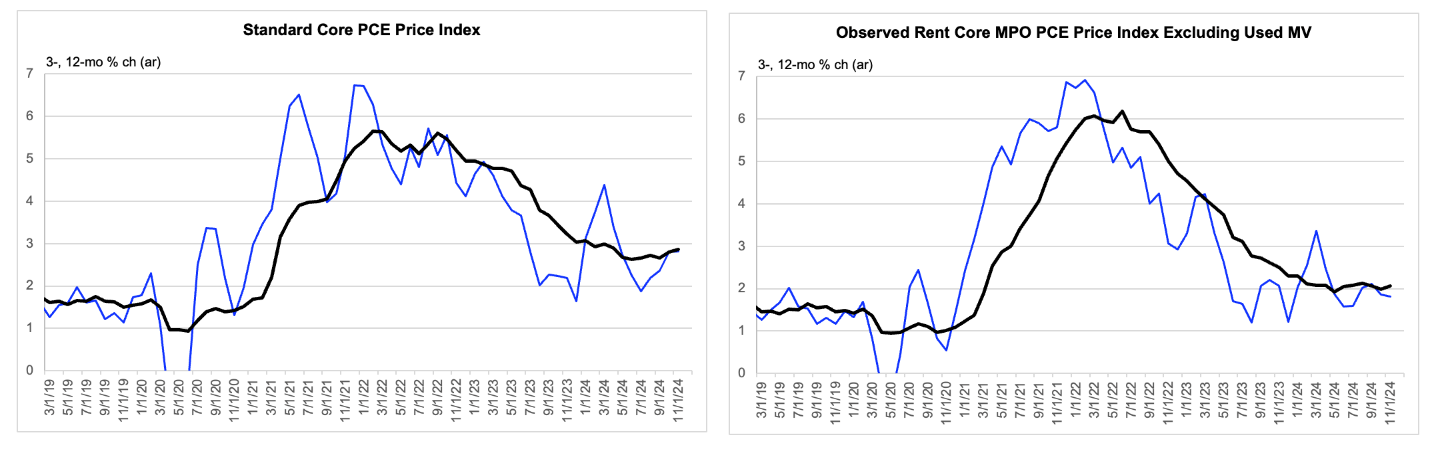
The use of marginal rents over average rents is not the major deal that it was, particularly during the month of November taken in isolation, because the (tightly) estimated value of the PCE Housing Index is right in line with my proxy of the trend in marginal rents. But if we are looking at 3-, 6- or (especially) 12-month inflation rates, this distinction is more important. Note in the chart below that what I call the single best measure of underlying inflation in the goods and services market, shown in the right panel, is running at a rate of about 2%. The exclusion of non-market prices from the single best measure reduces noise but also introduces a (hopefully roughly stable) bias. So 2% growth in the single best measure might be consistent with underlying inflation of about 2 1/4%. And I would concede that while this is the single best measure, it spots all the benefit of the doubt to the doves, particularly in the current environment. Still, with the labor market easing recently easing, in the old school sense of the term, and not just immaculately, this easily greenlights the ease on Wednesday and the notion that the Fed will suggest there is more to come, although probably with a reduced sense of urgency and with some debate about the scale of future rate cuts that will be appropriate. None of these are new thoughts by me, but just an attempt to put this now rote updating of rent trends in context.
Source: BEA, FH inferences from informed street consensus
Data are actual to October and estimates for November.

