Back Economics

Very preliminary thoughts on “Business Applications as a Leading Indicator”

Published on December 10, 2024

Download the PDF Report

By

Gerard MacDonell

A client kindly pointed out to me a paper published this past week at the National Bureau of Economic Research on Business Applications as a Leading Indicator.  


The paper is quite involved, and its ultimate objective is to show that applications to register businesses that have a “high propensity” to hire (as opposed to just provide self-employment) add significant explanatory power to a broader model using standard monthly business cycle indicators to predict nonfarm employment growth. I will not discuss that model here because its estimates are out of date and because it would be a great chore to replicate it. But in this note I offer brief and very preliminary thoughts on the paper and some simple pictures of the updated data.


Source: Federal Reserve Bank of St. Louis (FRED), FH calculations
Data are actual to October and seasonally adjusted. 

Away from the development and estimation of the model, the paper makes two descriptive points that seem particularly striking:

  • Business applications are highly predictive of actual business formations, which is a major advantage because business formations play a major role in the business cycle but are reported with an extensive lag. See the discussion beginning at the bottom of page 7 of the linked report for documentation of how applications reliably predict formations. 
  • Considered in isolation, so-called high-propensity business applications (HBA) are neither the most tightly correlated with subsequent employment growth nor the longest leading indicator of that. Retail sales are substantially better correlated, although with a much shorter lead time.  And single-family new home sales are both better correlated and lead by just slightly more.  But HBA provides the second longest lead, among the high-profile indicators tested, and has a reasonably high correlation. Table 5 on page 29 of the report documents this and is largely self-explanatory. 

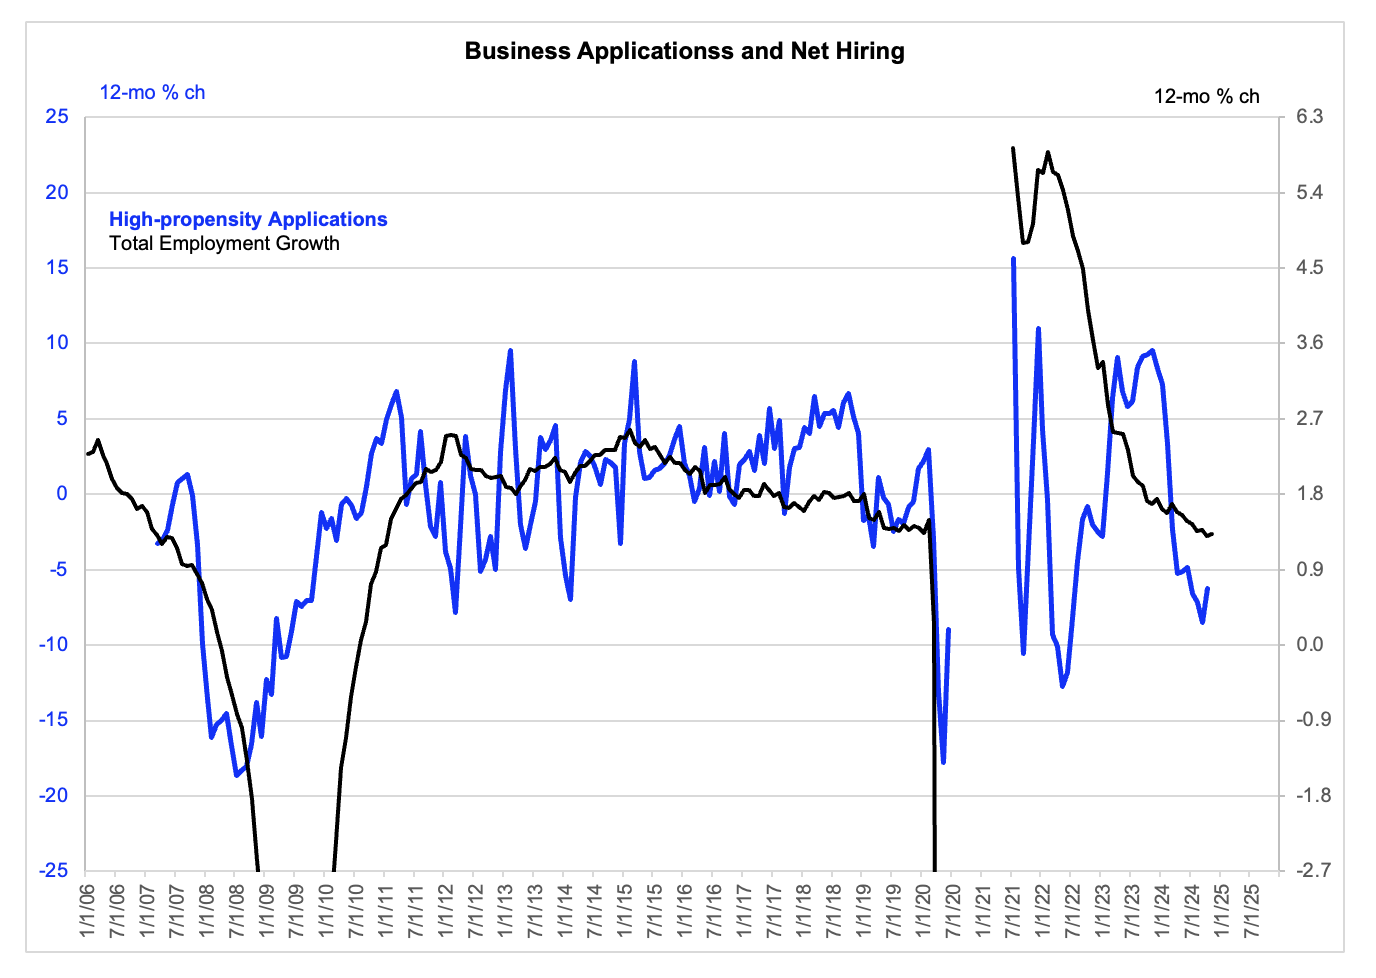
The paper finds that the correlation between the 12-month change of the HBA and the 12-month change of employment growth peaks when the former is lagged 11 months. And the chart below shows a history of the two series updated to the current period, although with no lag imposed and with much of the Covid period censored to avoid distraction from the noise there. 

Source: Census, Bloomberg, FH calculations
Applications data are actual to October. Employment data are actual to November.  Note that much of the Covid period is censored to avoid distraction created by noise there. 

The choice of dual vertical scale is subjective. But even taking that on board, it is obvious that the 12-month change of the HBA looks somewhat low relative to its own history.  This might be taken as evidence that the HBA – taken in isolation – predicts a further deceleration of employment growth.  But this raises what would be my main criticism of the paper, although admittedly a tentative one.


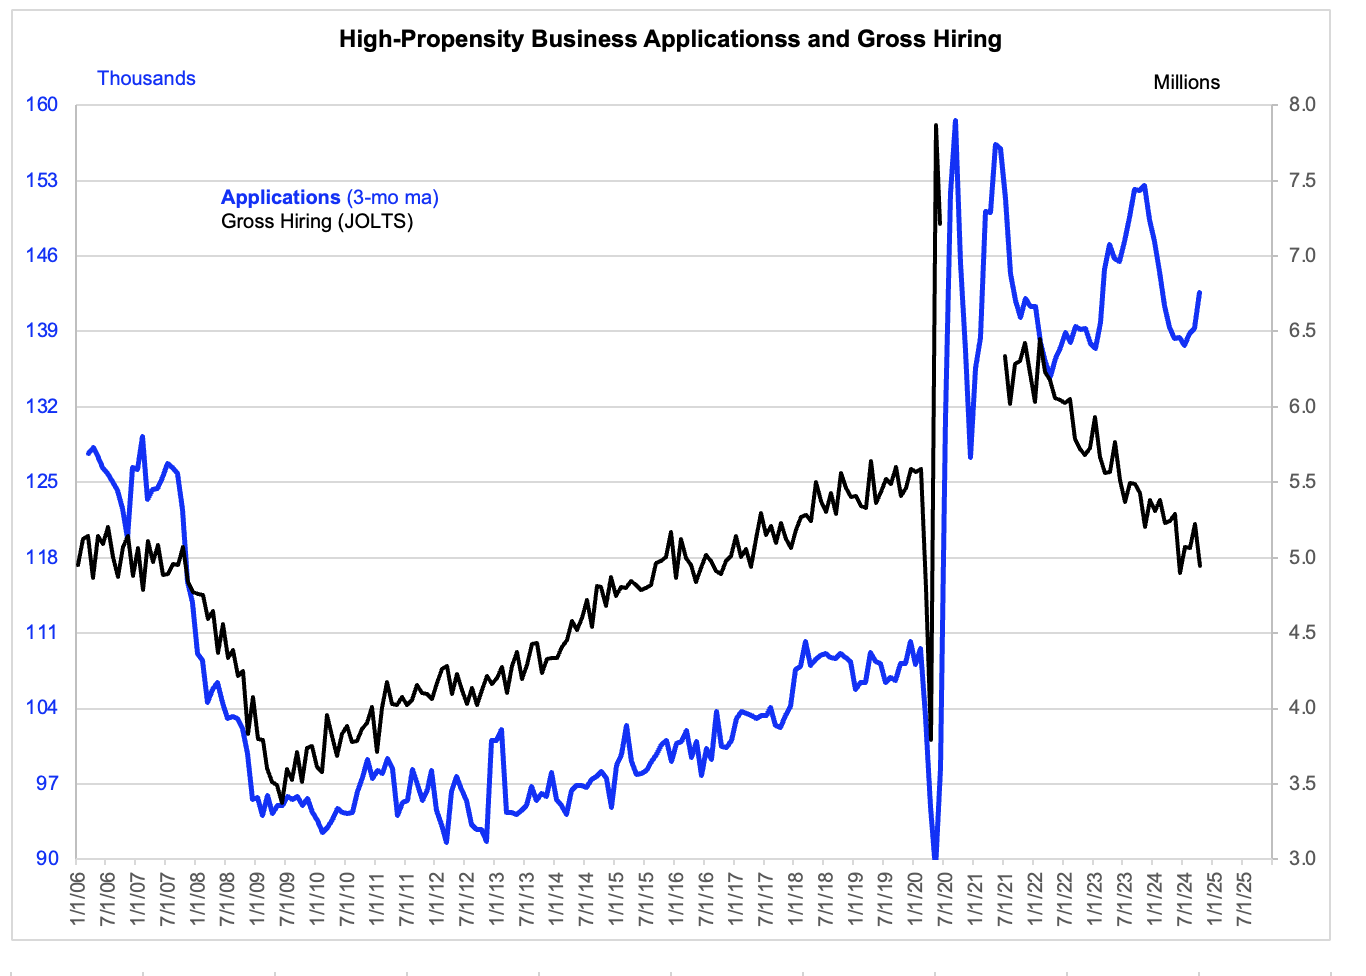
It is not obvious to me that the flow of new business formations, as predicted by applications, should be taken as a rate of change when being related to employment growth.  To some extent new business formations create employment growth. Or perhaps new business formations expressed as a deviation from some sort of mean create employment growth. For example, note in the chart below that the level of the HBA is related to the pace of gross hiring from the JOLTS report.  
Source: Census, Federal Reserve Bank of St. Louis (FRED), FH calculations
Applications data are actual to October. Employment data are actual to November.  Note that applications are here shown as a 3-month moving average and that the Covid period is largely censored.

To stake a strong claim about this would require a lot more work. But I would not take it as given that the HBA being lower than its quite high level 12 months ago is a long leading indicator of a downturn of employment growth.  My tentative conclusion would actually run the other way, from a recognition that the HBA looks fairly high – and would continue to do so even if we normalized it to the level of employment, although the charts do not depict that. I will continue to monitor this series and may express a stronger view when I have one.  For now, I would take it as marginally pro-expansion. 

DISCLOSURES AND DISCLAIMERS

Analyst Certification

The analyst, 22V Research Group, primarily responsible for the preparation of this research report attests to the following: (1) that the views and opinions rendered in this research report reflect his or her personal views about the subject companies or issuers; and (2) that no part of the research analyst’s compensation was, is, or will be directly related to the specific recommendations or views in this research report.

Analyst Certifications and Independence of Research.

Each of the 22V Research analysts whose names appear on the front page of this report hereby certify that all the views expressed in this Report accurately reflect our personal views about any and all of the subject securities or issuers and that no part of our compensation was, is, or will be, directly or indirectly, related to the specific recommendations or views of in this Report.

22V Research (the “Company”) is an independent research provider. The Company is not a member of the FINRA or the SIPC and is not a registered broker dealer or investment adviser. 22V Research has no other regulated or unregulated business activities which conflict with its provision of independent research.

22V Research, LLC is a professional services and independent publication organization. 22V Research, LLC is not a securities broker-dealer, not a member of the Financial Industry Regulatory Authority (FINRA), not a registered investment advisor (RIA) and not a member of SIPC.

Securities transactions, when offered, are offered by 22V Securities, LLC through LPS Capital, LLC. Certain employees of 22V Securities, LLC are dually registered as securities representatives of LPS Capital, LLC or Analyst Hub Securities, LLC. 22V Securities, LPS Capital and Analyst Hub Securities are members FINRA, SIPC.

https://brokercheck.finra.org/

Current Ratings Definition.

SECTOR OUTPERFORM: An “outperform” rating anticipates the company will outperform the S&P Regional Banking Index (peer group).

SECTOR PERFORM: A “market perform” rating anticipates the company will perform in line with the S&P Regional Banking Index (peer group).

SECTOR UNDERPERFORM: An “underperform” rating anticipates the company will underperform the S&P Regional Banking Index (peer group).

Limitation Of Research And Information.

This Report has been prepared for distribution to only qualified institutional or professional clients of 22V Research Group. The contents of this Report represent the views, opinions, and analyses of its authors. The information contained herein does not constitute financial, legal, tax or any other advice. All third-party data presented herein were obtained from publicly available sources which are believed to be reliable; however, the Company makes no warranty, express or implied, concerning the accuracy or completeness of such information. In no event shall the Company be responsible or liable for the correctness of, or update to, any such material or for any damage or lost opportunities resulting from use of this data. Nothing contained in this Report or any distribution by the Company should be construed as any offer to sell, or any solicitation of an offer to buy, any security or investment. Any research or other material received should not be construed as individualized investment advice. Investment decisions should be made as part of an overall portfolio strategy and you should consult with a professional financial advisor, legal and tax advisor prior to making any investment decision. 22V Research Group shall not be liable for any direct or indirect, incidental or consequential loss or damage (including loss of profits, revenue or goodwill) arising from any investment decisions based on information or research obtained from 22V Research Group.

Reproduction And Distribution Strictly Prohibited.

No user of this Report may reproduce, modify, copy, distribute, sell, resell, transmit, transfer, license, assign or publish the Report itself or any information contained therein. Notwithstanding the foregoing, clients with access to working models are permitted to alter or modify the information contained therein, provided that it is solely for such client’s own use. This Report is not intended to be available or distributed for any purpose that would be deemed unlawful or otherwise prohibited by any local, state, national or international laws or regulations or would otherwise subject the Company to registration or regulation of any kind within such jurisdiction.

Copyrights, Trademarks, Intellectual Property.

22V Research Group, and any logos or marks included in this Report are proprietary materials. The use of such terms and logos and marks without the express written consent of 22V Research Group is strictly prohibited. The copyright in the pages or in the screens of the Report, and in the information and material therein, is proprietary material owned by 22V Research Group unless otherwise indicated. The unauthorized use of any material on this Report may violate numerous statutes, regulations and laws, including, but not limited to, copyright, trademark, trade secret or patent laws.
