

Bloomberg’s WIRP function suggests that the odds of the Fed cutting the funds rate 25 bps two Wednesdays from now are about 85%. I suppose there might be slippage there of +/- 5 percentage points because of some basis noise. But the estimated probability should be close because the assumption built into the calculation that the only option is unchanged or down 25 basis points is, in this case, almost certainly correct.

Source: Bloomberg, CBO, FH calculations
Labor market data are actual to November.
In my view, the picture above presents probably the single best justification for the Fed easing in December and implying that further eases are coming, although with uncertain timing and of uncertain scale. The labor market is softening is the old school sense of the unemployment rate rising and, as I would prefer, of the employment / population ratio falling. Inside the box thinking would imply that the labor market is still on the tight side of neutral, because the employment population ratio is still above the “potential” level implied by conventional estimates of the NAIRU and potential participation rate. But the gap is now easily within measurement error, assuming we even subscribe to the logic of the Phillips Curve, which, in fairness, we need not. And more to the point for next week, Fed Chair Powell has made clear that he does not welcome any further easing of the labor market in the old school sense. And on Friday we got a good dose of that.
I would guess that the reason the market is not priced for 100% — or what WIRP would call a higher probability, indicating some chance of the Fed going 50 — is that there are CPI, PPI and IPI reports later this week, all coming ahead of the FOMC meeting. If these figures were to tee up a very high reading in the Core PCE Price Index, then there is actually some chance that the Fed would skip and perhaps even downplay the notion that it is confident that further easing is ahead. (I am trying not to overstate the point.)
Source: BEA, Bloomberg, FH calculations
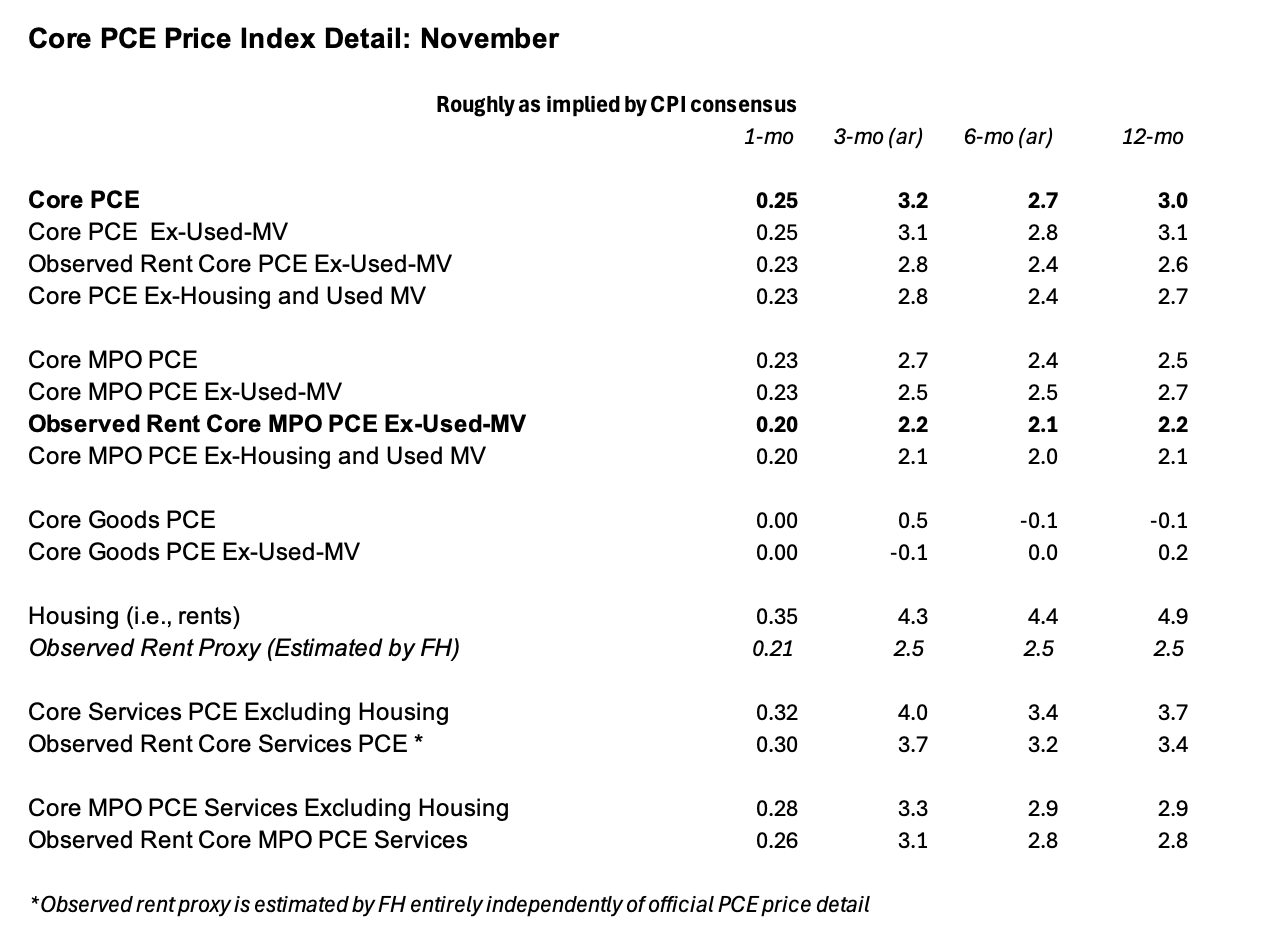
Data are actual to October and my preliminary slicing of how the consensus take on the core CPI maps to the PCE Price Index detail on roughly neutral assumptions.
What I want to do here is to emphasize that the consensus guess for the CPI is indeed consistent with the Fed cutting 25. I realize that may not sound so incremental – to suggest that the consensus outlook for an important indicator is consistent with the consensus outlook for the Fed’s response. But it may be helpful to understand roughly the lay of the land ahead of this week’s price reports.
Bloomberg polling shows that among the 61 “qualified economists” (surely the beginning of a joke), the guesses come in only two forms. Most guess a gain of 0.3%, but the rest guess 0.2% (which would be very dovish), such that the average projected gain is 0.27%. But let’s work with what is implied by the median, which this month, as often is just the guess with the most guessers: 0.3%.
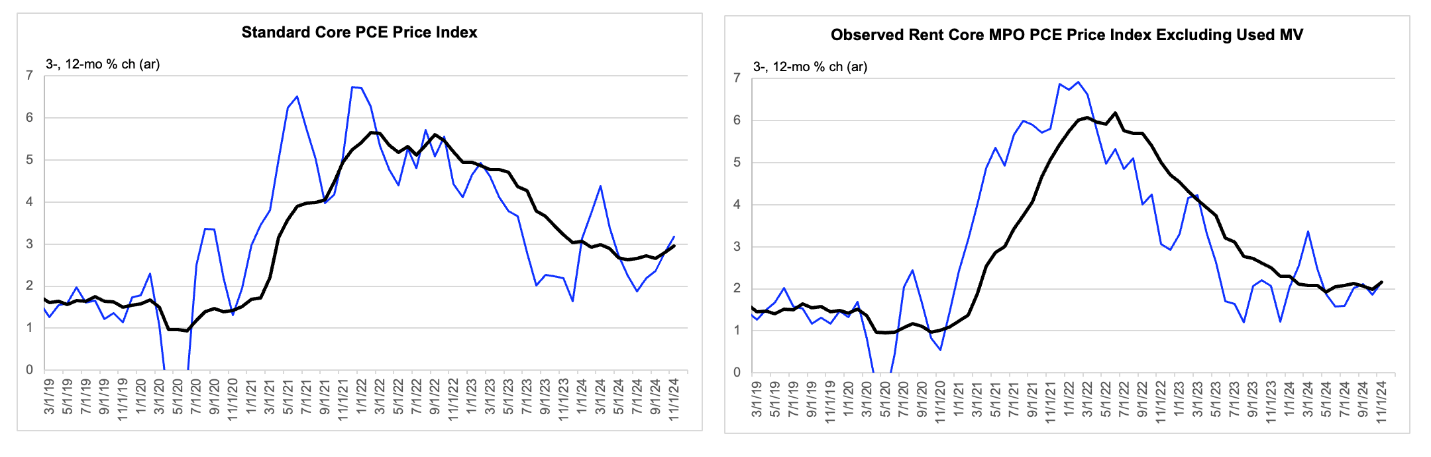
The table above shows how that would map to various slices of the Core PCE Price Index (on neutral assumptions about the mapping), including that index itself and my single most preferred measure, both of which are shown in bold in the table. And the picture below depicts the trends in those two measures, assuming my rough inference from the consensus for the CPI is confirmed.
Source: BEA, Bloomberg
Data are actual to October and FH inference from Bloomberg core CPI consensus for November.
The trend in the Core PCE Price Index is not so encouraging. The 3-month change is above the 12-month change, despite residual seasonality that might imply otherwise. And the 12-month change is quickening. Moreover, at around 3%, these measures of inflation momentum are about 100 bps too high. Because the Fed has trained us to look at the Core PCE Price Index, it would be tough for the Fed to sound an all-clear on inflation with these trends in place. And I do not expect them to sound an all clear on inflation. Rather, they will say that the conditions for further disinflation are falling into place and that they can cut now and then “probe” lower for the appropriate policy rate in a data dependent way.
I do think, however, that the right panel in the chart above provides a fairer sense of the underlying trend of goods and services inflation, in fact and as the Fed will perceive it. (These are seldom different in a way we can know ahead of time.) It strips out non-market prices, which have definitely resulted in an overstatement of actual inflation in recent months, even though I factor no interesting effect from that in November. It strips out used motor vehicle “prices.” And it replaces the lagging government measures of average rent inflation with my proxy of marginal rent inflation, which I concede might be off by +/- 50 bps, but without important effect. I call this the single best measure of underlying inflation in the goods and services market, i.e., excluding a direct assessment of the labor market. But I concede that this measure spots all the benefit of the doubt to the doves, at least in the current environment. Moreover, the exclusion of non-market prices is justified on the important grounds of eliminating harmful noise. But it also delivers a hopefully roughly constant downward bias of about 20 bps. So, think of the 2.15% reading in the 12-month inflation rate there as consistent with underlying inflation of 2.35%, which is a smidge high but not something that would stand in the way of the Fed easing – and hinting at more – given the evidence of the old school easing of the labor market.
It is totally conceivable that the labor market will begin to tighten again early next year. And it is also conceivable that we will get an inflation pulse from tariffs, to which the Fed will have to respond, by overseeing a tightening of financial conditions, although markets would determine the form that takes. But this note is about two Wednesdays from now.
An aside on rents
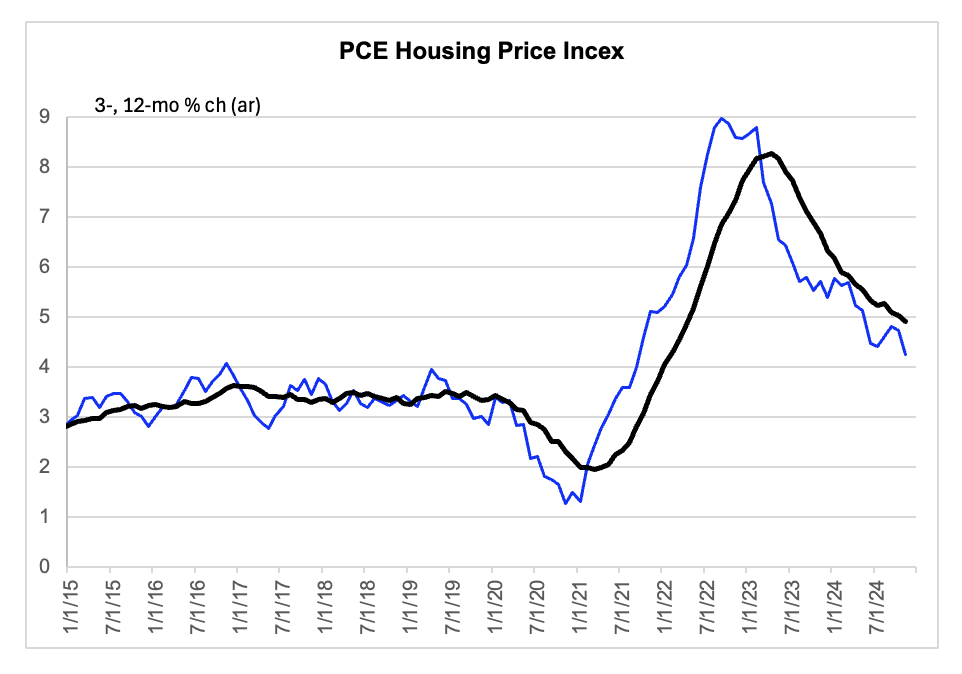
When mapping the guess for the Core CPI very roughly to the Core PCE Price Index I need to make an assumption about what others are assuming about rents in the CPI or what the PCE accounting calls “housing.” I assume others assume that rents as weighted in the PCE will be up 35 basis points, following 37 basis points in October. There is a sense in which that would be a best-case scenario. (We shall see.) If I am right that folks are assuming roughly a 35-bps advance, then that means that core inflation outside housing is well below the 0.3% gain penciled in for the core CPI. After all, within the CPI, rents have a weight of just over 40%. And yet, confirmation of that 35-bps advance might embolden folks to accept what strikes me as dead obvious anyway, that a continuation of low marginal rent growth virtually fates the government measures of average rents to decelerate further. Afterall, the 3-month rate of change would make a new low and the 12-month change would continue its descent.
Source: BEA, FH estimate
Data are actual to October and FH guess of what consensus is probably assuming for November.

