

This one falls under the rubric of politicians being completely clueless masterminds. Wall Street knows many such people, as I am sure you have noticed.
Anyhow, one of the more bizarre criticisms of the outgoing Treasury Secretary is that she tried to stabilize the bond market ahead of the recent federal election. I am not here to defend the Biden Administration, for which I did not vote in November, not that it matters. But if I were to criticize it for financial chicanery, I think I could find much lower-hanging fruit. For example, the student loan forgiveness program severely undermined the rule of law, making it a bit harder to criticize the new guy for what he is about to do. And the student loan program was regressive to boot. Compared to that, the Treasury Secretary trying to soothe the bond market seems sort of small beer.
In my view, what this whole discussion really shows, though, is that people have still not internalized what quantitative ease (QE) and quantitative tightening (QT) even are. They think these marginal policy initiatives involve money printing or even monetization (or their reverses), which is totally wrong. In fact, QE is simply the Fed shortening the effective maturity of the federal debt on behalf of the Treasury. And QT is the Fed lengthening that same thing. To see this, it helps to pierce the Treasury – Fed “veil,” to recognize that the Treasury ultimately feels the P&L effects of Fed operations, and to view the two of them together as the consolidated public sector. Accordingly, the Treasury might have its own opinion about what the average effective maturity should be and therefore might act in response to what the Fed is up to. And this way of seeing the world can easily explain why there has been rapid bills issuance during the QT era. But people have not internalized just how limited a tool balance sheet policy is, so they miss this one thing that it does do.
In saying this, I am not insisting that Yellen acted without any political impetus. (Her transition from Fed Chair to Treasury Secretary did seem to affect how she expressed herself, I concede.) Rather, the point here is more to reiterate that the popular discussion assigns far too much weight to “supply” – and manipulations of it – when assessing macro policy. For example, a higher federal debt tends to embolden the private sector and put upward pressure on r* through that channel. Beyond a certain point, a rising federal debt might push expected r* far enough above perceived g* to create financial stability concerns, after which point things could get dangerous, although we do not seem to be in the zone yet. But the idea that supply is the main story here is largely a distraction. This is a recording.
Bills supply has indeed surged

Source: Treasury Department, FH calculations
Data are actual to October.
With that as the context, let’s start with a picture of what people have been complaining about. The chart above depicts the trends in the main components of (non-indexed) marketable Treasury debt. As you can see, bills supply has contributed disproportionately to the financing of the outsized federal deficits. Since January 2022, the bills stock is up $2.2 trillion, which is $1.3 trillion more than we might have expected had the ratio of the bills stock to the total (depicted here) remained unchanged from the beginning of 2022.[1]
During this same period, though, the Fed has been doing quantitative tightening (QT), although entirely in securities of less than 10 years maturity. Nobody will admit it, even though they have had 15 years to learn it, but QT involves the Fed acting on behalf of the Treasury to replace bills financing with notes financing, which adds default-free duration to the market and – relatedly – effectively terms out the federal debt. If there is more supply and terming out than the Treasury judges appropriate, then this would encourage the Treasury to rely more on bills and less on coupons to fund the deficit. And to a first approximation, this is what has happened.
The Treasury might reasonably respond to this, you know
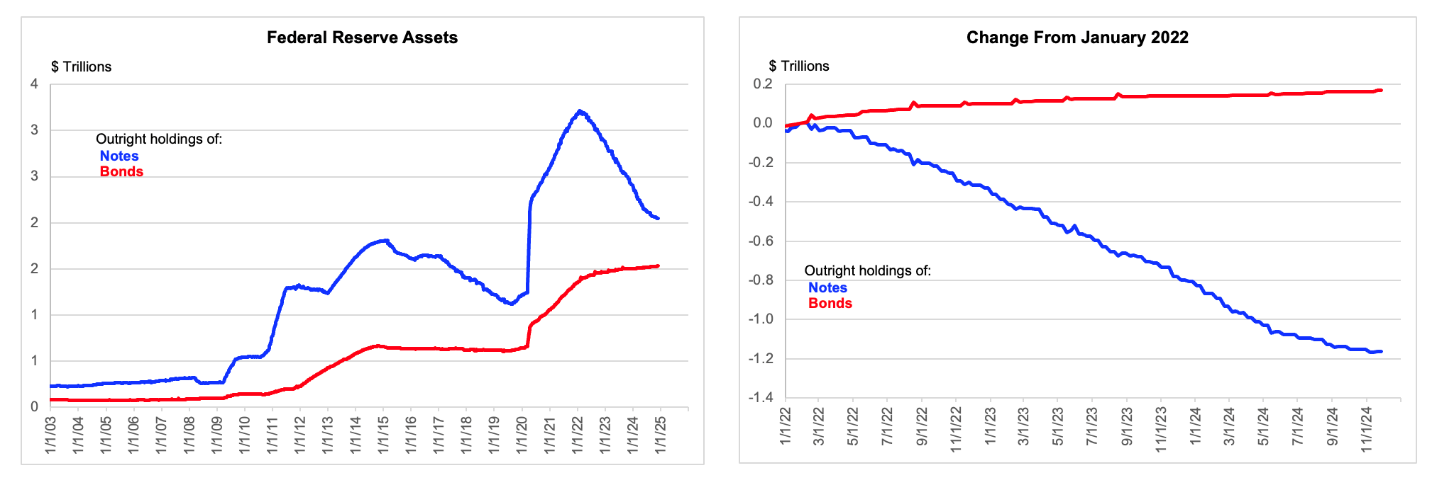
Source: Federal Reserve, H.4.1 Table 2
Data are weekly and actual to the end of November.
The argument I am making here is qualitative, incomplete and merely suggestive, although probably more realistic than 98% of what you may have read elsewhere on this. As a colleague I used to work with was often fond of saying, not always with a flattering tone, there is a “right way to do this,” which would be a bit more involved. To wit, what would really nail the argument would be if the Treasury produced a measure of the average maturity of the debt taking account of QE and QT, the P&L implications of which the Treasury effectively owns. I suspect that the Treasury has an internal measure of such a thing, which they can show to the incoming Secretary. And I also suspect that the CBO takes account of that same issue when assessing what the path of interest rates means for the debt – in the presence of any given path of the (ex-Fed) primary balance. But I do not have ready access to those estimates.
During the 12 years that I was repeatedly insisting that the Fed and the consensus were radically overstating the importance of QE — and supply generally as an influence on the level of Treasury yields (or the term premium, if you prefer) — I used to point out that the Fed itself should be publishing such estimates. After all, if the Fed claimed that manipulations of supply were so important, then couldn’t they at least work up some figures telling us how much duration was hitting the market even in the presence of QE? They never did. And I propose – again – for your consideration that we can easily imagine why. They were fibbing. Sorry.
In 2014, economists associated with the Brookings Institute published a paper arguing – among many other things – that it was unlikely that the supply effects of QE were the main reason for the low term premia at the time, because QE had not actually been large enough to offset the effects of the very large federal deficit and associated supply from the Treasury. In fact, duration supply had surged, but the term premium apparently fell anyway. At the time, fans of the efficacy of QE dropped back to the need to do the counterfactual. Yes, but imagine how low the term premium would have been pushed without the large federal deficit and heavy supply from the Treasury?!
Later, the consensus got more sensible and recognized that QE was just not that big a deal, because supply is not the main determinant of the term premium. Macroeconomic fundamentals anchored in business cycle and inflation risks are, as you can now read the Fed minutes. Here is the staff discussing the rise of Treasury yields ahead of the last Fed meeting. No mention of booming supply:
The increase in longer-term yields appeared to be mostly attributable to higher term premiums—consistent with investors’ perceived shift in the balance of risks away from outcomes characterized by slower real GDP growth and lower inflation.
Score settling aside, the point is that there is a right way to do this, which involves a very complicated set of calculations, of the sort attempted in that Brookings paper. If Janet Yellen had overseen a decline in the supply of, say, 10-year equivalents as a ratio to the nominal federal debt, inclusive of Fed QE / QT effects, then we might accuse her of being a bit political. In fairness, I have not really shown that she has not done any of that. And I am open to the idea that she might have done a bit.
But to the extent that her accusers make no reference to the case for the Treasury naturally, systematically offsetting a turn at the Fed from QE to QT, we can be very confident that they are mostly just making stuff up. Somebody is being political. We can debate who. And as a more general and practically relevant point, there is just a tendency within the popular discussion to radically overstate the (enduring) importance of supply, anyway.
[1] Bills, notes and bonds account for just under 91% of total marketable federal debt as of October. That plus inflation protected securities accounts for just under 98%.

