

The Core PCE Price Index was up 27 basis points during October. This is about 10 basis points too quick for the Fed’s taste and it followed a 26-basis point gain in September. However, markets appear to have taken this result in stride. Not only are short-term yields slightly lower than before the figure was released at 10:00 on Wednesday, but yields have also fallen from their level on November 14, when the Producer Price Index for October was released, and the informed consensus converged on the gain that ended up getting printed a couple days ago. Meanwhile, the S&P has moved to a new record high.

Source: BEA, FH calculations
Data are actual to October.
Of course, there is lots going on here and we can’t attribute all of it to the market’s interpretation of the inflation news. Having noted that there are a couple possible explanations of why the markets may have been relaxed about this news. And let’s take them chronologically. When the consensus for the core PCE was formed on November 14, it was obvious that highish expectation was driven by three influences that we might want to fade:
Used motor vehicle prices were expected to have risen steeply on the month, alone adding 3 bps to the core.
Another 4 bps was expected to be added from the portfolio management and advisory price index, mainly because the design of that index interprets a big rise of the stock market as inflation.
The housing services price index (i.e., rents) was expected to be up 37 basis points, even though marginal rent inflation seems to be running at a much lower pace, which I (specifically) estimate at about 21 basis points a month or 2.5% a year. This difference was expected to be worth another 4 basis points.
As a result, what I have characterized as the single best measure of underlying PCE inflation, which is shown in bold in the table above, was implicitly expected to be up 14 basis points. Movements of inflation as measured there would seem to be more meaningful than movements in the standard Core PCE Price Index. But my single best measure has a slight downward bias because the non-market prices that it systematically excludes have a slight upward trend in real terms; that is, they rise more quickly than market prices. So that 14 basis points mapped to about 16 basis points in “true” underlying inflation. Still, 16 bps would be less unnerving than 28.
The second reason that PCE price detail were taken in stride is that the data came in slightly more benign than the consensus had expected, particularly within the slices that I choose to emphasize. For example, my single-best measure was up only 11 basis points, consistent with 13 bps of underlying inflation. That allowed the 12-month inflation rate in the single best measure to tick down, even as the 12-month rate in the standard core ticked up. (It may be appropriate to emphasize these 12-month rates, if we worry that there is a little residual seasonality depressing the reported short-run inflation rates this time of the year.)
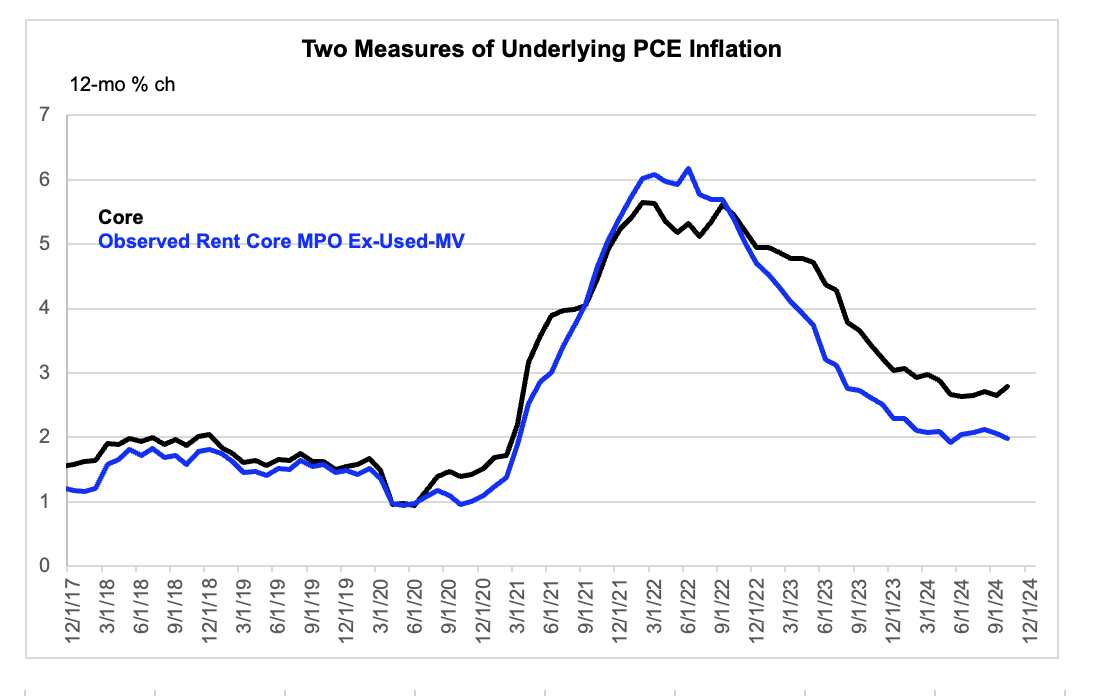
Source: :BEA, FH calculations
Data are actual to October.
So, that’s my take of the news on the month and on the day. And when interpreting the data flow and how the market may react, it is probably best to focus on the surprise, rather than on what we might take to be the underlying story. But with the “benign” (as I called it on Wednesday) news behind us, it might now be appropriate to step back and ask the broader question of what are we looking at here?
What we are looking at is an inflation backdrop that continues to look a bit sticky and suggests that the Fed will want to be careful here to guide aggregate demand growth to around the economy’s potential growth rate. The main issue is that inflation on the services side seems to have stabilized at a pace that is above what is consistent with the Fed hitting its 2% inflation rate over time. And this may reflect that inflation pressures in the labor market are stronger than the Fed has characterized them. There is some ambiguity here, I concede. But I would also insist that that is the point. Powell occasionally expresses himself with too much confidence on that issue.
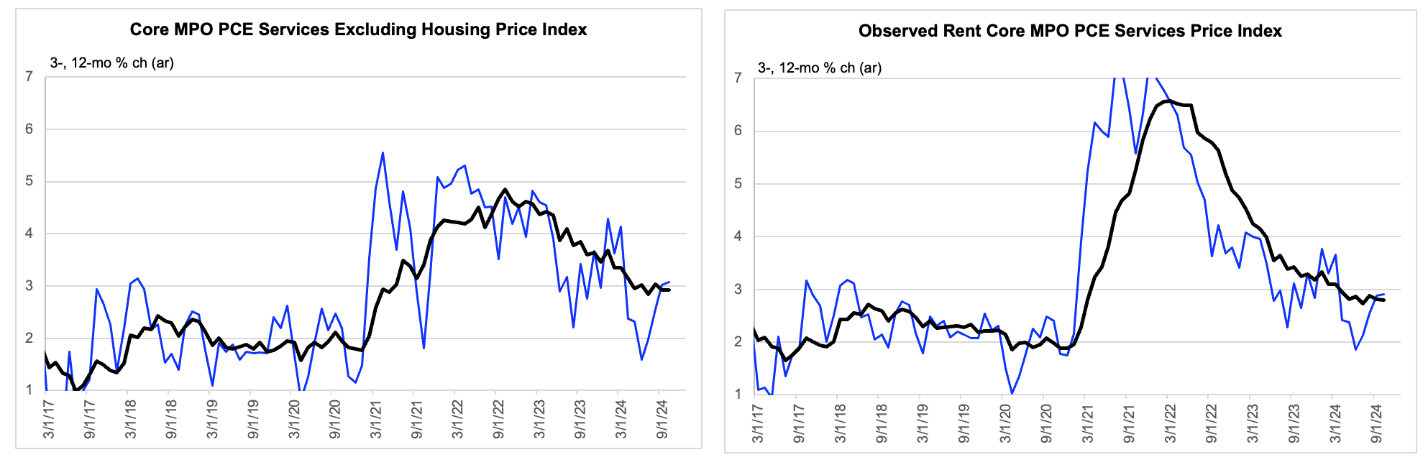
Source: BEA, FH calculations
Data are actual to October. I impose a common vertical scale on both panels to facilitate comparison.
Goods price inflation has been behaving much better very recently and would appear now to be in the zone of what we might expect in a world of 2% overall inflation. But will Trump leave that be? So far, it has paid to assume he will, despite his rhetoric, but the news very recently here has not been good, as I will elaborate on briefly at the end of this note.
Let’s take these issues in turn. The chart above shows two measures of underlying inflation in the service sector, each controlled in their own way for the fact that the lagging government measures of average rents are overstating marginal rents as measured in the various private sector measures that I have been emphasizing in recent months. The series shown in the panel on the left achieves this by simply excluding rents. And the series shown in the panel on the right, replaces the government measures of average rents with my proxy of how marginal rents are currently inflating, the estimated 2.5% a year. Separately, both measures strip out noise associated with non-market prices, which is appropriate for reasons I have discussed, but which generates a downward bias in the measure relative to “underlying” inflation is services of about 30 bps (ar).
The series shown in the left panel is my MPO version of what is sometimes referred to as the “super-core” inflation rate, following Fed Chair Powell’s parsing of the data. The measured inflation rate there is about 3%, with the 3-month rate running slightly above that and the 12-month rate running slightly below. And the 12-month rate itself has scored no cumulative decline in five months. The Observed Rent version of that same concept, replaces rather than removes, rents. And it is running at a marginally lower rate, but one that similarly looks to have stalled at an inflation rate that is slightly too high. To elaborate a bit, the 2.8% measured inflation rate implies underlying services inflation of 3.1%, which would imply overall core inflation of 2.4% if goods price inflation were expected to be zero. Moreover, this measure spots all of the benefit of the doubt to my claim that we should be watching marginal rents, rather than using government rents or simply excluding all rents.
In contrast, underlying inflation in the goods sector appears to be running just slightly below zero, which is below where we might expect goods inflation to be in an environment of target overall inflation and the normal trend decline in the relative price of goods (in relation to services or the general price level). However, this is at least marginally worrying for three reasons.
The first reason does not really relate to the current pace of goods price inflation but is more about the fact that inflation in goods has been holding down overall underlying inflation. Traditionally, goods price inflation tends to be noisier and less closely linked to business cycle conditions inside the US. Another way to put this, is that a given pace of overall underlying inflation is more benign, if there is a higher contribution from goods offset by a lower contribution from services.
Secondly, it is widely believed that goods prices overshot during the initial Covid recovery period. And if that perspective is valid, then perhaps the recent disinflation in goods can be viewed partly as a correction of that mispricing, rather than evidence that underlying inflation pressures here are as low as they appear. I concede that this is an open question, but again it tilts us toward perhaps putting a little more weight on what is going on in services.
Third, low inflation in the goods sector would definitely not survive the imposition of tariffs even ¼ as large as what Trump has most recently been proposing, including the 25% level Trump wants to slap on Canada (I mean Americans buying Canadian products) because of the national security threat that our northern neighbor is imposing. (???) For example, Goldman researchers have recently estimated that Trump’s latest idea would add 90 basis points – at the peak of the impetus — to the annual inflation rate. Of course, an inflation shock is an inflation shock, and I suppose it does not really matter that this would operate primarily through goods price inflation, assuming inflation expectations hold. But I confess to appreciating the symbolism of the tariffs overturning the one part of the recent inflation story that has recently looked unambiguously good.
This third point may seem jarring, given that I have been pushing the view that the base case is that Trump does not impose punitive (to Americans) tariffs. And the news recently has been somewhat constructive on this point, in the sense that Trump’s selection of Scott Bessent as Treasury Secretary has been interpreted as evidence that Trump might effectively have been just kidding about large tariffs, for reasons I – and many others — have gone over. However, it has also long seemed obvious that at some point in this process we might get a scare or two that Trump is actually serious.
By the middle of last week, the Bessent effect was presumably already in the market, if the cringe-inducing commentary around how clever a strategist he might be is anything to go by. And then the news came of Trump proposing 25% tariffs on Mexico and Canada, because of the national security threats they impose (?), and with an extra 10% thrown on China for their relatively good behavior. So, from a market’s perspective, the risks here may be higher than they were. Not that I have any edge in DC watching. This is just a comment on the sequencing of the news flow. And returning to the main theme of this note, the US does not really need an exogenous inflation pulse here.
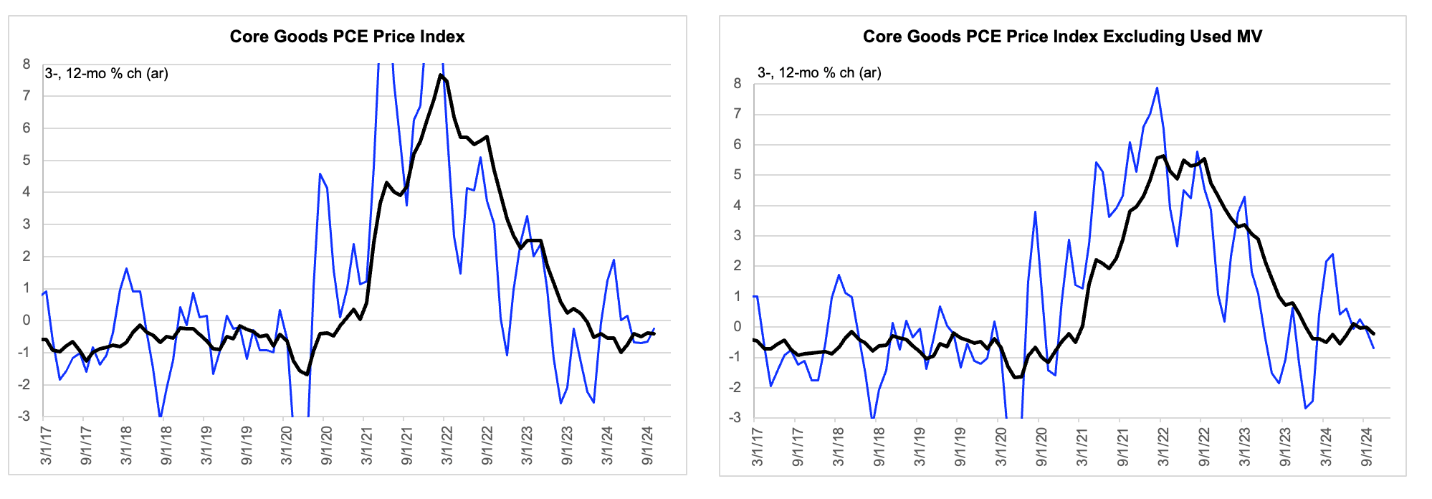
Source: BEA, FH calculations
Data are actual to October. I impose a common vertical scale on both panels to facilitate comparison.

