Before I get to the main point of this note, which is technical background for the particularly curious, I should mention why I dwell on this issue of marginal vs average rents. It is because I have carved out a niche in this research area, and not so much because the issue remains pressingly important. The gap between marginal and average rent inflation has narrowed substantially during the past couple years, although average rent has proven to be sticky at a still meaningfully elevated level. And separately, commentary from Fed Chair Powell has guided consensus toward the take that I have been pushing, which makes this stuff admittedly less incremental.
In yesterday’s note on how best to use the New Tenant Rent Index (NTRI) recently developed by economists at BLS and Federal Reserve Bank of Cleveland, I argued that the NTRI probably provides the single best measure of the level of marginal rents up to about two years ago, especially if our interest is in speculating on the path of the official government measures of average rents, which are tightly logically linked with the NTRI, having the same weighting, hedonic adjustments, etc., and differing only in “scope.” As a colleague who read my note pointed out pithily, we are not going to outwit the BLS at their own game! So, just use the NTRI which is probably roughly correct and is almost certain to look correct in fullness of time. If we do so, we come away recognizing, among other things, that the gap between marginal and average rents – measured in level terms — has probably closed more than the consensus recognizes.
In this note, I want to discuss how this idea is programmed into my calculations of various slices of what I call the Observed Rent Core PCE Price Index. These slices all substitute in my proxy of marginal rents for the lagging official government measures of average rents, including owners’ equivalent rent. When working up my proxy of marginal rents for all periods prior to a year ago, I use a centered and smoothed value of the NTRI. And I do this despite a couple weaknesses with this approach. First, the NTRI is imprecisely estimated between two years ago and one year ago. And second, the NTRI applies only to direct or tenant rents, whereas I am interested in a measure of marginal rents that includes owner occupied residences. When thinking about how things looked up to a year ago, simplicity probably trumps being precisely correct. And using a rough estimate of marginal rents certainly provides a better sense of past inflation pressures than sticking with those lagging government measures of average rents.
For the past year, where precision matters more I simply impose my mosaic-based, subjective judgment that marginal rent growth in the entire housing stock, including owner occupied units, is running at a steady 2.5% sequentially. This guess could be off by 50 basis points, but that won’t matter practically speaking very much.
The right should lead the left

Source: BEA, BLS, CoreLogic
BEA housing price data are effectively actual to October. Observed rent proxy is developed as discussed in the text and is simulated to October.
The chart above shows in its left panel the PCE Housing Price Index (i.e., rents, as measured in the PCE) through the estimated value in October, which will be almost precisely correct, as will be confirmed tomorrow. In the right panel is my proxy of marginal rents, which is admittedly a hodge podge over time. But what matters is the subjective judgment that the sequential growth rate there is now a steady 2.5% a year. The figures I produce in my regular monitoring tomorrow will reflect that judgment. As you can imagine, substituting the figures from the right panel for the figures in the left panel will make the underlying inflation rate look lower recently.
Uh-oh, that sinking feeling an analyst hates
Let me conclude here on a bit of humor in service of a serious point. Today, I came across this bit of research from the Cleveland Fed into the gap between marginal and average rents. What makes it striking is that it is written by some of the same authors that produced the NTRI that I have described as the most authoritative measure of the level of marginal rents for all periods up to about two years ago. As I mentioned yesterday, applying this measure suggests that the gap between marginal and average rents has been cut to less than a quarter of its peak value (of 8%) in the past couple years. And if measured average rent growth does not soon slow, the gap may be entirely eliminated by first quarter. By applying the NTRI, I got more confident that I was measuring that gap correctly and I lowered my best guess of it.
However, get this! The authors at the Cleveland Fed just last month presented work along the lines of what I used to do, emphasizing the CoreLogic SFRI and finding a gap that peaked at a higher level and has closed less. This gave me a sinking feeling that I might have somehow misinterpreted those prototype research series, the NTRI and its twin All Tenant Rent Index (ATRI). Afterall, some of the designers of those metrics claim that the gap between marginal and average rents is still 5%, whereas my inferences suggest less than 2%.
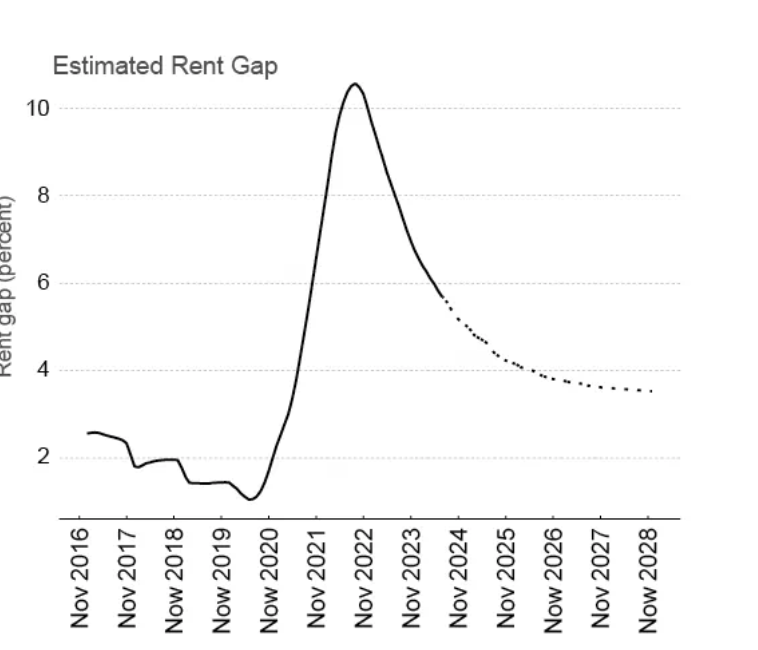
But two considerations have cleared that sinking feeling away. First, as the chart at the bottom of this note shows, the authors at the Cleveland Fed show that the vast majority of the gap that is likely to be closed has been closed. That is exactly in line with my take, practically speaking, although one can wonder about analysis that leaves any gap at all in the forecast. I am sure there is a reason, just not one I know of.
Second, and closely related, I contacted one of the authors and she very kindly got back to me quickly. She confirmed that my approach is fair, and that I am not somehow misinterpreting her data. She explained further why she and her co-authors took the approach they did in the note linked above. The SFRI inflation rate is more accurate for the most recent periods and she and her co-authors preferred to work with monthly rather than quarterly data when discussing the outlook for direct rents in the CPI.
I do not find those arguments convincing, for the following reasons. First, it is important to know where the relevant gap here peaked, and we all presumably agree that the NTRI vs ATRI provides the best measure of that, even though the NTRI is not reliably estimated for the past several quarters. The gap peaked more than two years ago.
Second, the greater reliability of the SFRI compared with the NTRI for the unseasoned vintages can be accommodated by overwriting the NTRI with what is implied by the SFRI inflation rate (only) for the past two years, as I did in my work yesterday.
And finally, it is trivial to convert quarterly to monthly data. It seems odd to assign 9 PhDs to a subject to assess it properly and then to drop the lessons learned there because converting from quarterly to monthly is awkward within a simulation.
Not to be harsh. Reasonable people will disagree about how best to apply the NTRI, and I remain both curious and persuadable on these issues. Also, those Fed and BLS researchers know a lot more about index number theory than I do, which would not be difficult. But for now, I will stick with the take I set out yesterday and dial up my point that people are hesitant to incorporate the useful lessons of the NTRI because it is subject to revision.
How the authors at the Cleveland Fed see the gap between marginal and average rents
Ok, it need to fall another couple percentage points