

The Personal Income and Consumption report for October will be released on Wednesday at 10:00 AM, a day early because of the Thanksgiving holiday. The report will, as always, include an update of the PCE Price Index and the core (ex-food-&-energy) component that the Fed follows closely. The rounded gain there is expected to be up 30 bps, which may be a bit sobering, although it will meaningfully overstate underlying inflation on the month, as I have documented in earlier notes.
We know from the individual price detail in the CPI that the housing, i.e., rent, component of the PCE Price Index will be reported up about 37 basis points on the month – or at an annualized rate of 4.4%. The 3-month rate of inflation will be about 4.7%, which is slightly higher than the 3-month rate was three and four months ago. So, one could infer that rent disinflation has stalled at a pace that is about 2 percentage points higher than we would typically associate with the Fed hitting its 2% inflation target. (Real rents appear to have a structural upward trend, but a very shallow one.)[1]
Powell sounds relaxed about this apparent stall

Source: BEA, BLS, FH calculations
Data are actual to September and effectively actual to October, because the price detail from the CPI are very predictive.
And yet Fed Chair Powell has if anything begun to sound more confident in recent months that rent inflation, as officially measured, is fated to slow meaningfully over the coming months. The reason for this is the familiar one. The rate of inflation in so-called marginal rents on new leases has already fallen to a slightly-below-normal pace. And this very probably implies that the rate of inflation in average rents, picked up in the CPI and PCE Price Index, will also decline soon enough, although with a timing that is both hard to predict and apparently of secondary importance to the Fed Chairman. (Indexed securities traders need more precision, I realize. But I am not your guy.)
This note reiterates and updates the case for siding with Powell on this issue, at least as the central case. We must continue to watch the private measures of marginal rent growth, such as the CoreLogic Single Family Rent Index (SFRI) and Zillow’s Observed Rent Index (ZORI) to ensure that the inflation rates there are in fact behaving. But so long as they do, it probably makes sense to bet with Powell.
While the Fed was slow to pick up on this issue, by this point in the story an appeal to authority is probably also valid. The odds that the Fed staff are not best-of-class informed on this rent issue would be, by now, very low. I bet they even have the CoreLogic data in electronic form, unlike me.
Authoritative measures of marginal and average rents
Source: BLS, FH calculations
Data are actual to Q3, although contemporaneous and near contemporaneous data are heavily subject to revision.
The main novelty in this update is its increased emphasis on the BLS’s New Tenant Rent Index (NTRI), which was developed a couple years ago to obtain an authoritative measure of marginal rents. While the NTRI is not new, its relevance has probably risen over the past few quarters, as a couple important themes that are discernible through the index have come more clearly into view. First, we now have a bit more confirmation of the intuitively obvious idea that marginal rents and average rents have a common trend. If that is indeed the case, then a prolonged period of low marginal rent inflation will reliably be followed by a deceleration of average rent inflation, as picked up in the government data. I have long been willing to speculate on that common trend, simply based on logic. But the NTRI provides a progressively more helpful empirical test, admittedly without proving the point.
Second, there has been some uncertainty about how large a gap opened — in level terms — between marginal rents and average rents in the wake of the Covid shock. And related, it has not been clear how much of that gap has closed, as marginal rent growth has slowed steeply, while average rent growth has remained sticky. The main source of uncertainty here is that we have not been able to be confident about the precise cumulative rise of marginal rents since the end of 2019. But for reasons I will discuss below, the NTRI can now provide – again authoritative – insight into this question. And it suggests the gap is probably largely closed, which would imply that there is no longer much reason to expect sequential average rent growth to run much ahead of marginal rent growth.
It may seem odd, but I suspect that the consensus may be overlooking the signal from the NTRI because the consensus had initially hoped that the NTRI could do something that it is not well suited to do. When the NTRI was first published, there was some hope that the most recent rate of inflation recorded there might provide some direct insight into the likely rate of inflation in the direct rent component of the CPI – and, therefore, PCE Price Index. But the NTRI is not well suited to that task because contemporaneous vintages of the NTRI are subject to very large revision. And it is possible that people were frustrated by that issue and became unfairly dismissive of the NTRI, even though it can be very useful when handled properly, if I may.
What the NTRI can and cannot do
The design of the NTRI is covered in gory detail in a research report from analysts at the Cleveland Fed and BLS (henceforth Cleveland/BLS), which I have already circulated a few times, because it seems to surface practically important points. Much of the detail there is mind-numbing, and I admit not to having mastered all of it. But there are two aspects of the NTRI that you and I need to know about. First, source data for the NTRI are a subset of the individual rent observations that ultimately make their way into the official government statistics. So, the data quality control, hedonic adjustments and proper benchmarking to the actual rental housing stock are very rigorous, far more so than in say the SFRI, ZORI or other private measures of marginal rents, as the Cleveland/BLS report points out.
Moreover, there is a very tight analytical link between what the BLS data show for marginal rents and how they are ultimately (presumably) realized into average rents. This advantage is not strong enough for us to draw the conclusions we might want to draw with certainty. We don’t really know the future path of marginal rent growth, and we cannot necessarily infer causation from the empirical relationships involving the NTRI. But at least we don’t have to worry that the marginal rent data are somehow non-representative. Especially if we are interested in how average rents will perform in the official government statistics, the NTRI is by construction very representative.
The second thing we need to know about the NTRI is that the discussion immediately above requires a caveat. Contemporaneous estimates of the NTRI are based on a very limited sample size, which is imposed by the necessity of following the turnover of specific individual rental units in “pairwise” comparison. This is particularly an issue for initial observations of the fourth and first quarters, when lease turnover is seasonally low. But it is an issue for the busier remaining quarters as well and means that the most contemporaneous observations of NTRI are subject to large revision, as the sample size effectively increases. As a result, the measured rate of inflation for the past quarter, past four quarters or even the past eight quarters, is not very reliable. And as mentioned, this may have dissuaded others from even following the NTRI. But there is a reasonable get around available here. The report from Cleveland/BLS has documented that CoreLogic’s SFRI is very closely correlated with the NTRI for the historical periods where NTRI is authoritative. And this means that it is roughly appropriate to overwrite the last couple years of the NTRI data with what would be implied by the inflation rate in the SFRI. In other words, we can use the NTRI for periods where it is authoritative, which is the vast majority of its history. And then we can use the SFRI for the recent periods where it is relatively (not fully) authoritative. Each in its place and according to the season.
Simple intuition is confirmed, although admittedly not proven
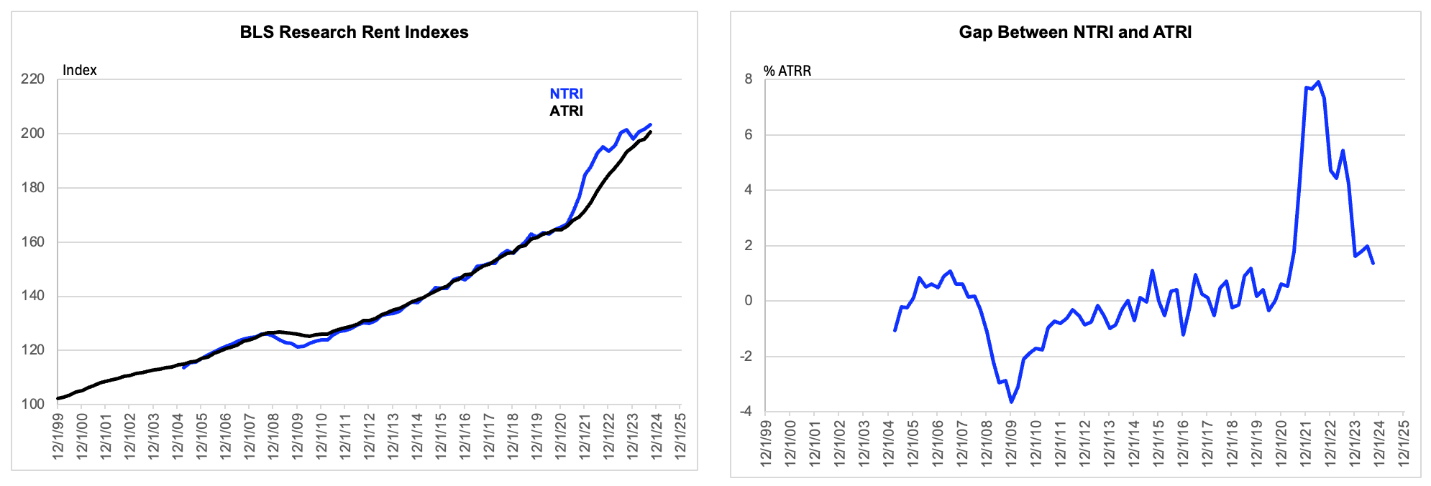
The chart above shows an almost two-decade history of the level of the NTRI as well as the All-Tenant Repeat Rent Index (ATRI). In the interest of brevity, I don’t want to spend much time on the ATRI because it is not all that different from the direct rent measure in the CPI. The only difference is that the ATRI relies on pairwise comparisons rather than the panels rotating on a six-month frequency, which introduces a lag of about three months between true average rent inflation and its measurement within the CPI and PCE Price Index. Think of the ATRI as roughly truth, although it is subject to very minor revisions, which is why the BLS does not use it in their official measures. And think of it as very closely linked to the NTRI, differing only in “scope,” that is, in the distinction between lease turnover and lease renewal, or marginal and average rents. I like comparing measures that are in fact commensurate.
The chart provides some confirmation of, without proving, the simple intuition that marginal rents and average rents have a common trend. And this is important because the presence of a common trend would mean that a continuation of low marginal rent inflation would inevitably lead to slower marginal rent growth – if only sustained. The comment immediately above imposes causation. I am assuming that marginal rents can effectively be taken as causal. Indeed, that is the bet here. The rest is arithmetic.
The chart also suggests that the gap – in level terms – between marginal and average rents hit a peak of 8% (of average rents) in the second quarter of 2022 and has subsequently narrowed to just 1.4%. This implies that there is no longer much reason to expect that the need to “correct” a gap in levels should incline average rent growth to run that far ahead of marginal rent growth. Indeed, if the recent pattern of low marginal rent growth and sticky average rent growth were to be sustained, then the gap there would be eliminated by the first quarter of next year. And at that point, the case for average rent growth running ahead of marginal would be entirely eliminated.
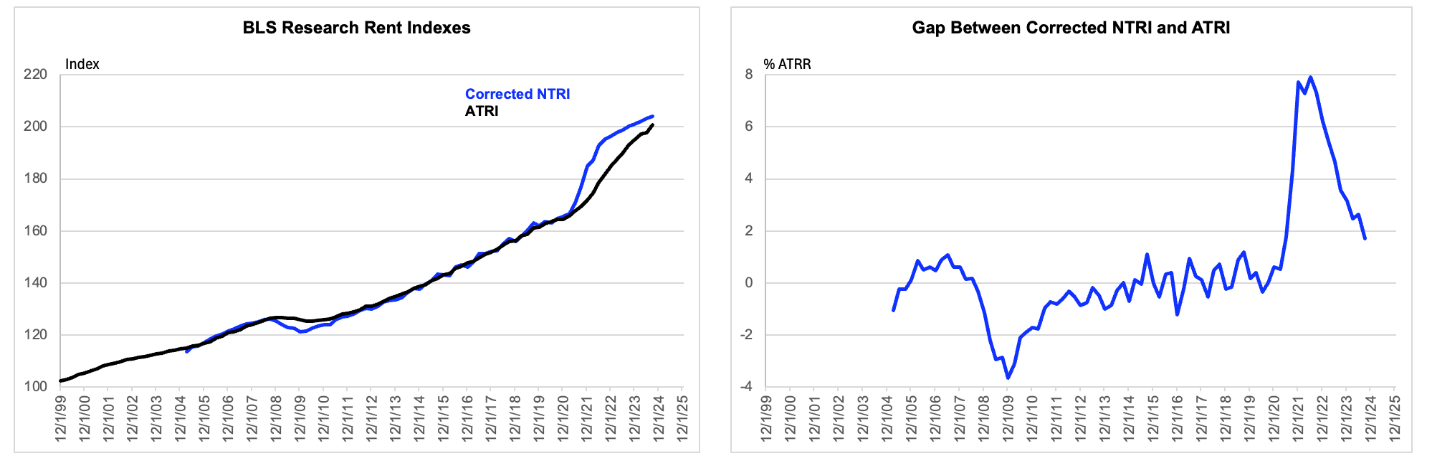
One weakness in the claim made above is, as mentioned, that the NTRI is not reliably estimated for contemporaneous and near contemporaneous periods. Also as mentioned, a get-around is to overwrite, say, the last eight quarters of the NTRI with what would be implied by the inflation rate in CoreLogic’s SFRI. The empirical rationalization for this is as follows. The Cleveland/BLS report notes that, in seasoned vintages of data, the CoreLogic index looks like a smoothed version of the NTRI. Furthermore, the average absolute difference between the 4-quarter inflation rates in the NTRI and SFRI has an average of less than 90 bps in seasoned vintages. And this is convenient, because the SFRI is not subject to much revision.[2]
Overwriting the last 8 quarters of NTRI with what is implied by SFRI does not change much
Source: BLS, CoreLogic, FH calculations
Data are actual to 2022 Q3 and then as implied by inflation in the SFRI through Q3 of 2024.
On current data, the rapid inflation in the NTRI associated with the Covid shock appears to have been broken at the end of 2022. In the seven quarters since then, the NTRI has risen at a cumulative rate of 2 ¼% a year, although with unusually high volatility, probably reflecting the same-size issue mentioned above. The inflation rate implied by the SFRI is not so different, which means that the overwriting does not have much effect on the measured gap – in level terms – between estimated marginal and average rents. The measured gap narrows from an unchanged 8% in the second quarter of 2022 to 1.7% as of the third quarter of this year. And it has the same practical implication for prospective average rent inflation.
Tougher bits
And thus concludes the relatively high conviction part of this argument. The main uncertainty in this argument relates to how marginal rent growth is behaving right now and how it will perform going forward. On the second part of that question, I am going to plead ignorance on the grounds that it is probably more useful to focus on so-called situational awareness here than on imponderable speculations. I don’t have a good reason to expect that marginal rent growth will accelerate, but I will try to monitor the data carefully and objectively, updating in real time as required. I will leave it to the gods to decide what marginal rent growth “should” be doing. And this should be ok, at least so long as the marginal rent growth is showing no signs of quickening, because I doubt either markets or the Fed will place much weight on speculations of a turn there.
As I mentioned in a note last week, the 12-month rate of change of the SFRI has been decelerating steeply recently, and it ran at just 2% as of September. The Cleveland/BLS study mentions that in the historical data, including seasoned vintages of the NTRI, the SFRI looks tightly correlated with the NTRI, even though the former has some daunting design weaknesses. Its benchmarking does not make it representative of the rental housing stock and it does a casual job of controlling for hedonic adjustment, etc. According to the report, the SFRI is tightly correlated anyway, because those issues appear – at least in historical analysis – to be of secondary importance. Relatedly, the main “puzzle” in the rent data had related to scope, the difference between marginal and average rents, which that report meant to disentangle, which it did successfully.
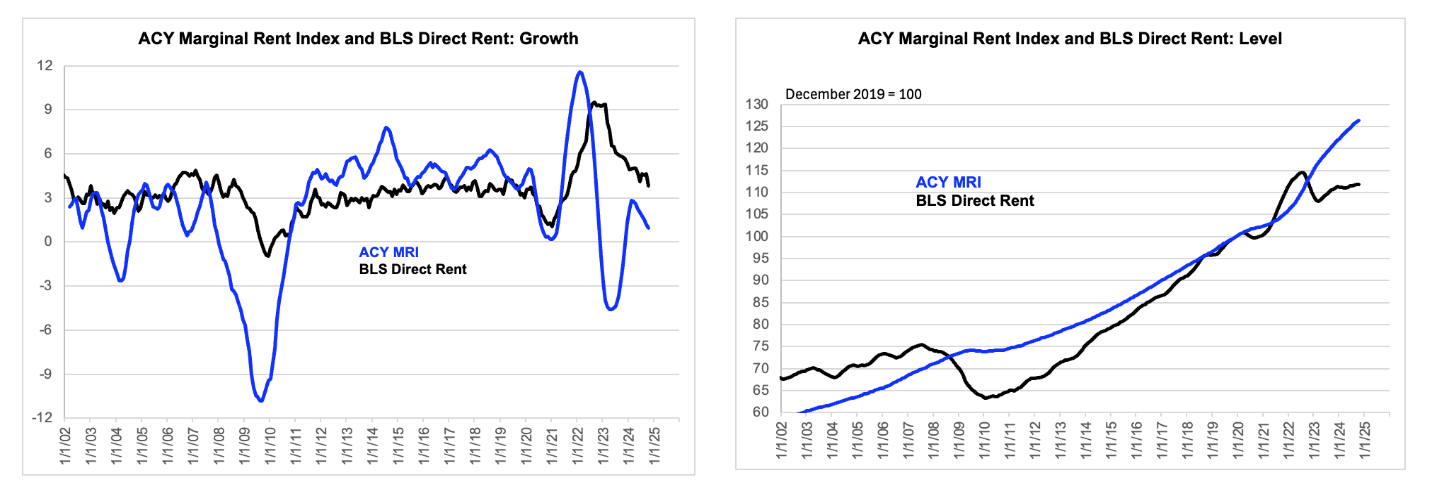
Meanwhile, other measures of marginal rent growth are generally performing in a benign way. The inflation rate in the ZORI is running ahead of the inflation rate in the SFRI, which is one reason my estimate of marginal rent growth is, at 2 ½%, slightly ahead of what is implied by the SFRI. But for now, the ZORI is showing more signs of slowing than of quickening, although flat is also a reasonable inference. And measures focused on the multifamily sector, such as the Apartment List data and the ACY Marginal Rent Index (MRI) developed at Penn State are well behaved, in the sense of implying disinflation. Here is a fun fact related to the ACY index, though. The Cleveland/BLS study suggested that this index was almost as reliable as the SFRI at capturing marginal rent trends in real time. But since the production of that report the ACY index has behaved very erratically, although its current signal is disinflationary.[3]
Oof
Source: ACY via Penn State, Federal Reserve Bank of St. Louis (FRED), FH calculations
Data are actual to October. Please note that I compare the ACY measure of marginal rent with the official government measure of average rent, because the latter is reported at the same frequency, i.e., monthly.
And this brings us to another ambiguity in the story. Just because the SFRI is reasonably well correlated with the authoritative measure of marginal rents in the historical data does not mean that it will be so in what is now real-time application. Maybe the SFRI will suffer the fate of ACY MRI. There are reasons to suspect that the SFRI might, in principle, either overstate or understate true marginal rent inflation. The SFRI is based on the half of the rental market that excludes apartments, although it does include what we might call duplexes. To the presumably meaningful extent that the apartments are in particular being pressured by the ongoing flood of supply, as the builders clear out their stock of units under construction, the SFRI might be unusually upward biased in the current environment.
On the other hand, we need to keep in mind the distinction between direct rents and owners’ equivalent rent when thinking about the impetus to overall inflation from inflation pressures in the housing market. This note has focused exclusively on direct rents, because the dynamics in direct rent are important to understanding even OER. It is a fun fact that we can think of the OER data as being effectively the government measure of direct rent, just reweighted so the observations are benchmarked to the owner-occupied, rather than tenant occupied, housing stock! But when I work up my measure of marginal rent growth, it is meant to apply to housing inflation generally, inclusive of OER.
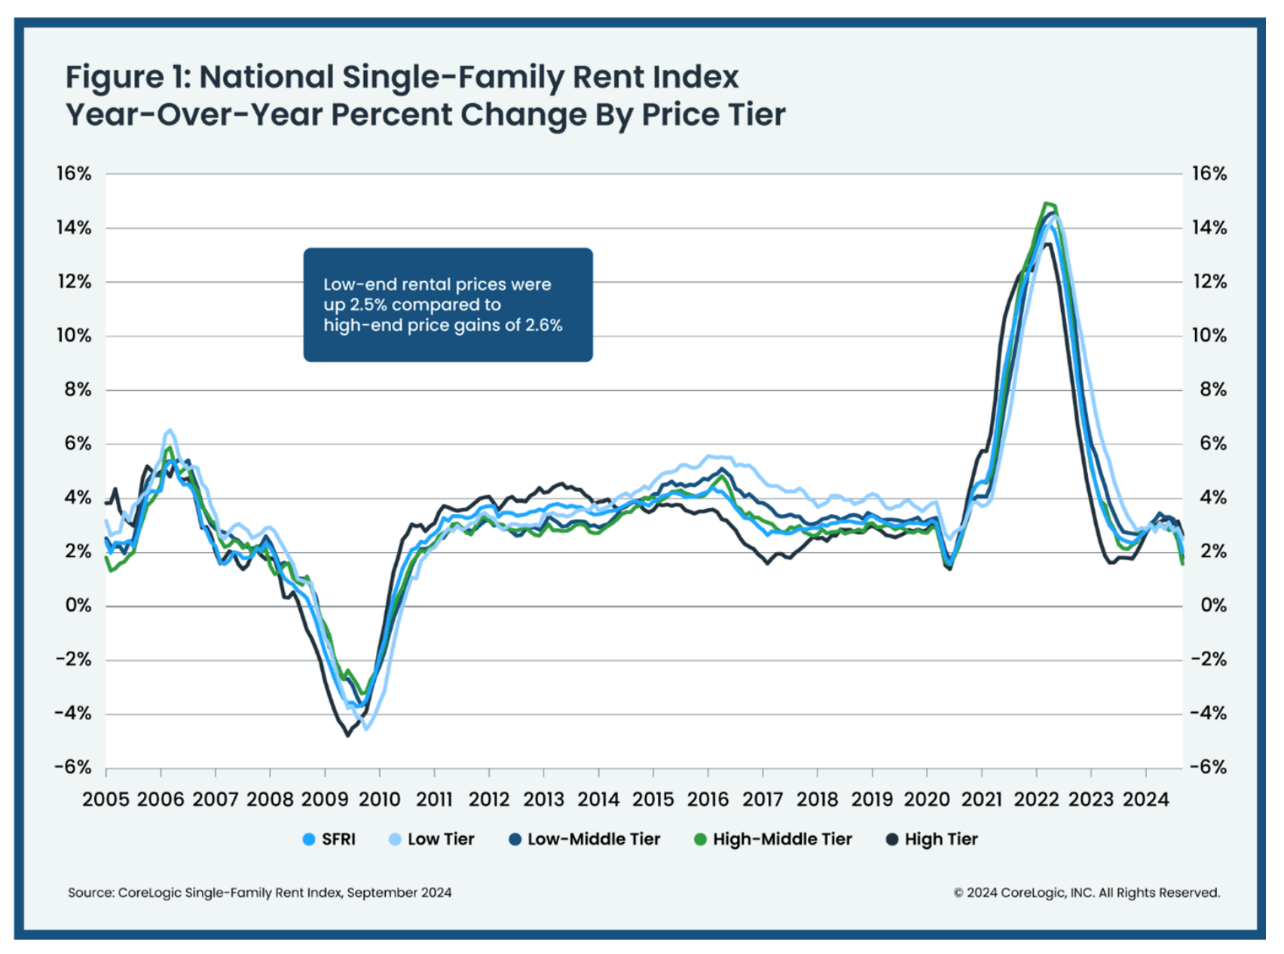
And that is newly a bit more relevant than typical, because OER measured in the government data is proving a bit more sticky than direct rents. And this may reflect knowable pressures from both supply and demand at the upper end, which tend to be owners – and of better properties. A low end semi-detached unit will be a closer substitute for an apartment than might be your typical suburban McMansion, like the one you probably live in. And the high end has more quickly rising spending power these days, as highlighted amusingly in the most recent report from CoreLogic:
High-end price growth (2.6%) slightly outstripped low-end gains, a sign that some renters are leveraging advantageous economic conditions to upgrade – including wages that are up buy (sic) 40% since last September.
The 40% rise of wages over the past year may have escaped your notice! (Kidding, my own strong move is to put a groaner typo often in the very first sentence.) But if the high end is outperforming the low end within the largely detached rental space, then proxies of marginal rent growth may be an unusually downward biased measure of housing price inflation, inclusive of OER, which has a ¾ weight in the total.
Disinflation, especially at the low end
Source: CoreLogic as linked above.
One implication of this is that we need to be humble about the precision with which we can measure marginal rents. As mentioned, I use 2 ½% sequential marginal rent growth when calculating my Observed Rent versions of the various slices of core PCE inflation, which I will update on Wednesday after 10:00. I could easily be talked up to 3%, and I doubt Powell would be cockier. But if I am off by 50 basis points there, then my Observed Rent Core PCE Price Index estimate will be off by less than 9 basis points at an annualized rate. It is not a huge deal. What would be a larger deal would be rejecting this effort to isolate the trend in marginal rents and just going with what the lagging government measures of average rents show. My guess is that the Fed leadership will continue mostly not to do that. It is false precision, but I figure they might put a 2/3 to ¾ weight on a sense of marginal rents that rhymes with my own and then the remaining weight on what the official data are showing.
If I were the incoming Treasury Secretary’s Shadow! Fed Chairman, I would be at least at the upper end of that range and possibly beyond. But there is no need to be ideological here. And thankfully the stakes are lower than they were, average rent inflation has cooled a lot from its earlier peak, even though it has proven irritatingly sticky recently. Moreover, the next meaningful move in average rent inflation is very probably a deceleration.
Within the official measures of average rents, direct rents have disinflated slightly more steeply than OER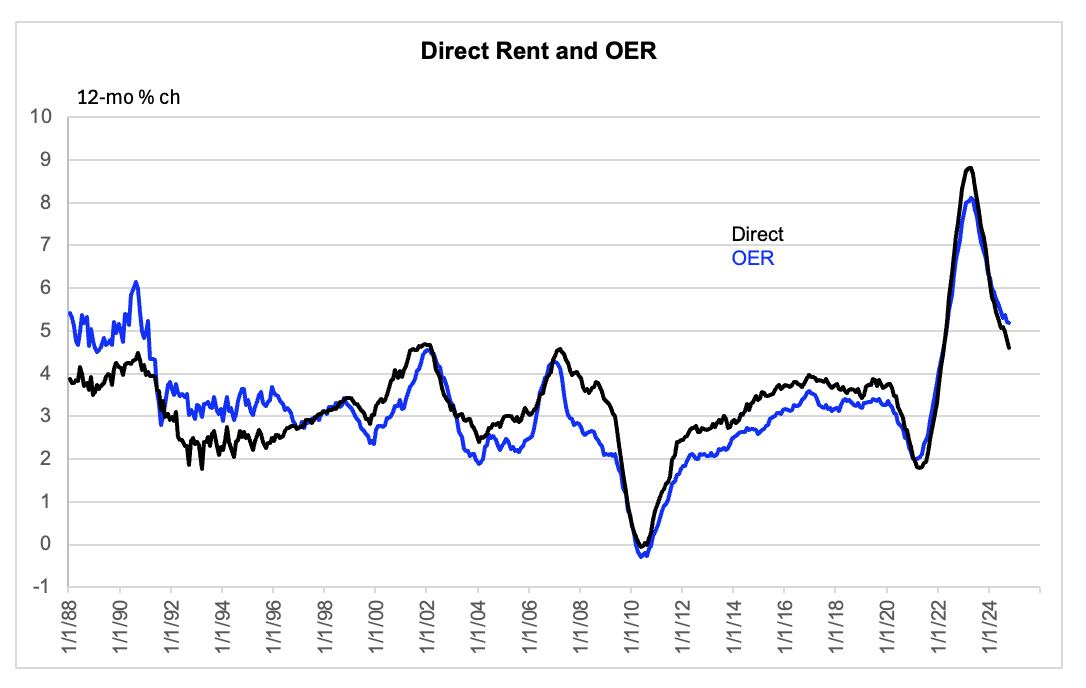
Source: Federal Reserve Bank of St. Louis (FRED), FH calculations
Data are actual to October.
[1] Just for illustration, if the 17.5% of core PCE inflation that is accounted as “housing” were to run at 4 ½%, then the remaining 82.5% of the core would have to run at just under 1.5% for overall core inflation to print at 2% and the Fed to expect to hit its broader inflation target over time. Separately, please note that the acronym ATRI drops an R in the interest of symmetry with the NTRI.
[2] I do wish the Cleveland/BLS study had addressed the relationship between the NTRI and SFRI in level terms, that is, taking account of the tendency for cumulative gaps to be “corrected” over time. Maybe the level of the NTRI is roughly correct even for recent periods, even though the quarterly or even annual growth rates are subject to errors. But the study is silent on that issue.

