

Main points:
- Short to medium term recession risk is low
- Rates risks still tilted slightly the high side, with Trump policy arguably being the tie breaker there
- Fed Chair Powell has implicitly become more conventional, a win for realism
- I doubt last week’s dip in equities was durably about my rule of law worry
What new policy will act on
The outlook for US economic growth is slightly diminished but still solidly trend or better, and recession risks are still low at both the short- and medium-term horizons.
News around inflation in goods and services markets had been unremittingly upbeat for the five months ending two months ago. The September data reversed that pattern, coming in clearly on the hot side. And interpretation of the October data seems likely to be controversial. What I boldly call the single best measure of underlying PCE inflation is on track to come in benign. However, that measure spots the benefit of the doubt entirely to the doves in this environment, and alternative / more conventional measures look more troubling, especially following Thursday’s release of the PPI, which lifted estimates for the PCE Price Index.
The economy’s refusal to confirm the Fed’s expectation of a meaningful growth moderation and the less wonderful inflation data have encouraged Fed leaders, including Chair Powell, to sound progressively less dovish over the past several weeks. In response to this, and more importantly to the data, the expected policy path has steepened, allowing the forward funds rate to settle at an implied real rate of just over 1 ¾%, if we accept – as is conventional when making such calculations – that inflation will also settle soon at the target. That is within range of where I would put the neutral real rate or r*, even though the higher federal debt has helpfully raised r* over the past few years.
But for now, the risk around rates is probably still slightly tilted to the high side, because the inflation debate is not fully resolved, cyclical and financial conditions dominate considerations of where “neutral” might be, and the more likely elements of Trump’s policy agenda seem rates hawkish on balance. On that latter point it is admittedly hard to speak with much confidence, and DC watching will remain important.
Last week, I slinked away from my attempt to see the glass half full in terms of how Trump might affect risk asset prices, because the attempt indeed took an effort and because his cabinet picks seemed bold. Weaker equity prices late last week might seem to ratify that nervousness, although the market has hardly moved dramatically. My own guess is that it is too soon for markets to begin to react to some of the longer-term considerations that unnerve me, specifically the challenge to the rule of law. So, I would guess for now that last week will eventually prove to have been a case of distribution, if that is the right term, to people with a sunnier disposition. Risk off and duration on because the rule of law is under attack might be a bit hasty here. I will stick to economics topics. Good luck.[1]
Core PCE and the single best measure are in bold

Data are actual and consensus for October.
This month, how we measure “underlying” really matters
The difference between what I take to be the single best measure of underlying inflation and what the consensus watches has not been a big deal during most of this past year. Some analysts bizarrely reacted to the CPI itself, failing to internalize that the CPI is relevant only to the extent that the details within it inform our best guess of how the PCE Price Index will print a couple weeks later. But directionally, the Core PCE Price Index has been close to good enough for government work. And my own slicing and dicing has tended just to dial up the signal from the conventional measure. For the five months ending two months ago, the goods and services price data looked good – and even more so than you know! I refer here to my interpretation of the data, not to my own forecast, which was getting revised brighter over that earlier period.
Things look a bit different for October. The inference I draw from the informed consensus’ tracking of the Core PCE Price Index and its higher-level detail is that the single best measure of underlying goods and services inflation will have run sequentially at 14 bps during October. The single best measure has the advantage of being less noisy and more meaningful, but it does have a downward bias, mainly because it strips out noisy non-market prices, whose higher trend inflation rate needs to be restored. So that 14 bps in the single best measure would translate into 16 bps of underlying inflation, if you will forgive the false precision throughout. And that works out to about 2% inflation annualized, which is easily low enough to qualify as “good.” As Powell has pointed out, the test is not whether inflation would fall further, but whether it could be even almost as good as it was during the five months ending in August.
The problem is that this single best measure spots the benefit of the doubt to the doves. I think that is fair and appropriate, but debate is entirely around whether my measure is too dovish. After all, it strips out the lagging government measures of average rents and replaces them with my proxy of marginal rents. And it strips out noisy financial services prices, which were up a lot – and misleadingly – during October, because of earlier strength in equity prices. Core inflation inclusive of those government rents looks higher and the higher financial services prices mean that the unrounded Core is on track to print at +0.3% in October. You can see how that might give folks pause, including folks who ghost the Fed leadership’s speeches.
Separately, there is the issue of seasonality. A client often complains to me that Powell likes to insist that the early year inflation data are faulted by seasonals but does not follow up by saying that this must mean that the other data are flattered by the same effect. One way to get around this is simply to look at the 12-month changes. And in the right panel of the chart above, you can see that the single best measure of the standard Core look to have inflected differently in October. Just as an aside, I should mention that 2.2% in the single best measure maps to underlying inflation of 2.4%, which is better than it was, but even so not quite there.
Less rates ease expected, even as the Fed has delivered
Data are actual to the Friday close.
Forward policy rate settles above 3 ¾%
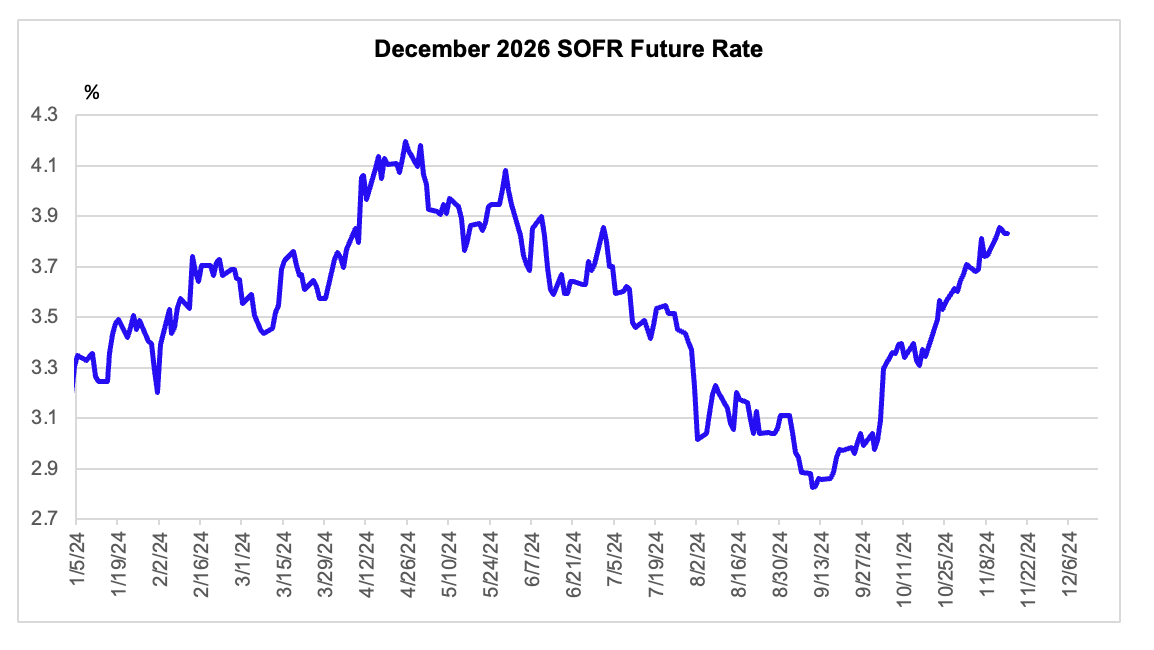
Since (the day before) the Fed cut the funds rate 50 bps on September 18, the policy rate implied by the December 2026 SOFR contract has backed up 95 basis points. And the futures strip is pancake flat after 2026. So, markets price that the nominal funds rate will settle at just over 3 ¾%, as the mean of the distribution. Without having looked at options markets, I would say we could interpret that mean as incorporating a central case rate that is slightly higher, but with a left tail risk of the wheels coming off the economy and rates falling steeply.
Assuming that the Fed guides inflation back to 2%, and re-anchors the short run inflation expectation at the same level, this would imply a real policy rate of just over 1 ¾%. I assume the neutral real rate, r*, (say, two years forwards) has risen in recent years, mainly because of the desirable rise of the debt/GDP ratio. But I would not say that implied market pricing of 1 ¾% is too low. However, the risks around rates are probably still tilted slightly to the upside on balance, because we are the point of the cycle where policy restraints is still required, because financial conditions are easier than a rote comparison of r with r* would suggest, and because Trump’s policy agenda seems to have rates hawkish implications, at least as I currently see it, which can change.
The mean of the distribution is just above 3 3/4%
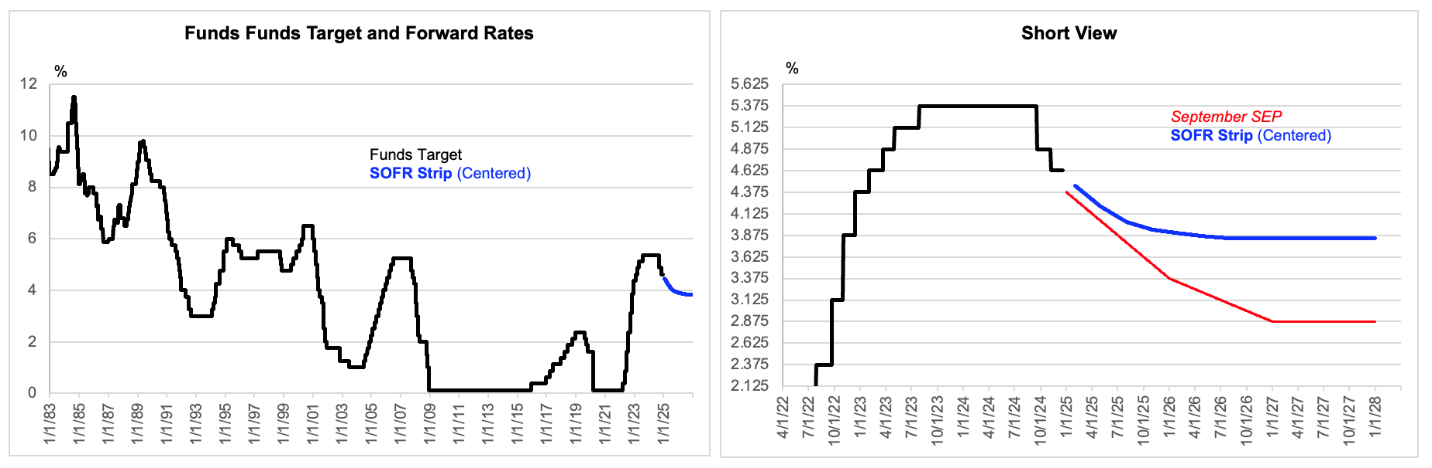
Data are to Friday close. The SOFR strip needs to be centered — in time — because those futures price a 3-month average rate.
Powell gets a bit more conventional
The point above about financial conditions brings me to the talk that Powell gave to the World Affairs Council (named for the times!) on Thursday. During that talk Powell seemed to back a bit further away from his view that monetary policy is necessarily restrictive – on the old grounds that r is so obviously above r*. It would be wrong to say that the shift has been abrupt. But increasingly, he is speaking as though the Fed is now in the business of probing for the appropriate policy rate, which might not be so far from the current setting.
Powell is famous and appreciated for his breezy informality, which I think gets him in trouble. Yellen’s nerdy precision was much easier to follow and invited criticism, a strength. In any case, Powell now suggests that the economy’s strength effectively gives them the luxury (my term) of proceeding carefully. That leaves the Chair off a bit too easily. He had been aiming for weaker demand growth than we have seen. But he miscalibrated, I would say by overstating the role of the funds rate and missed to the high side. We hang on his every word because he gets to choose the funds rate as much as two meetings out, and not because what he claims is so.
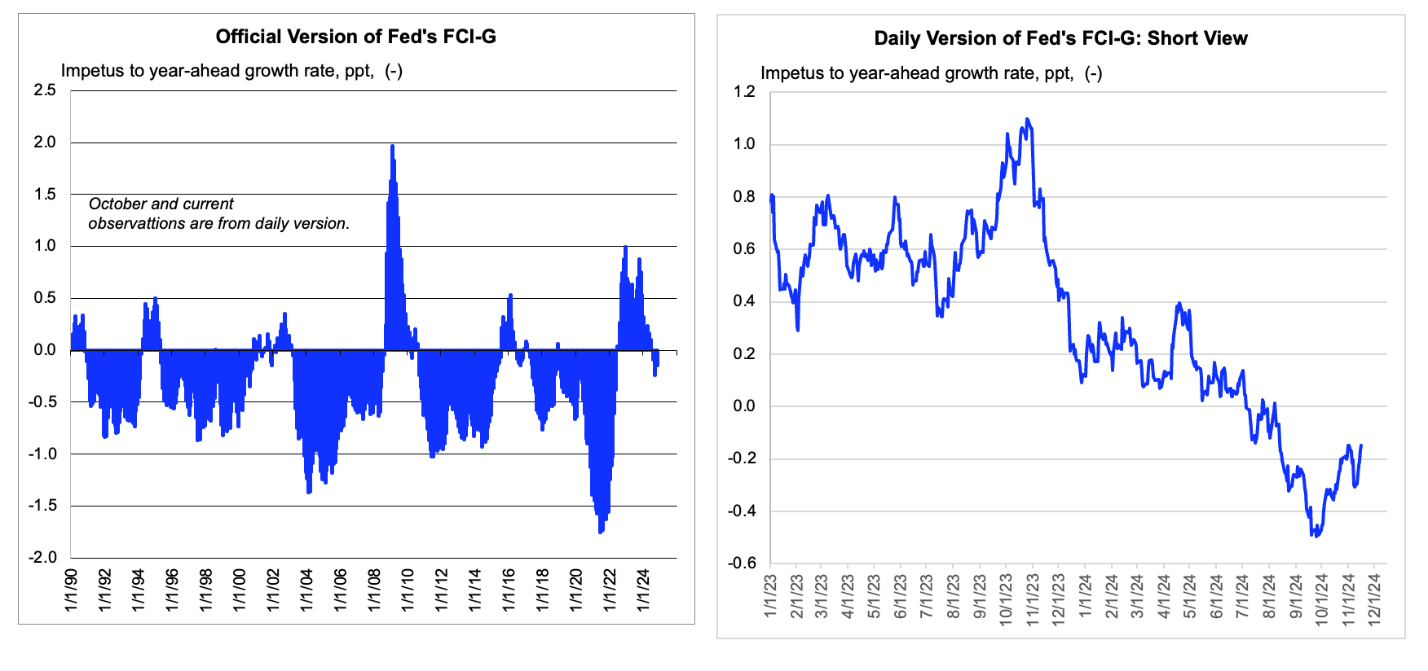
Powell might better have chosen Dallas Fed President Lori Logan’s words from a couple days prior, especially given that the World Affairs Council was actually in Dallas! On the Fed’s measure, overall financial conditions reached their maximum stimulus a few days after the Fed cut 50 basis points in September. But measuring from the day before they cut, just to be consistent with my discussion of the forward funds rate above, I would note that my daily version of the Fed’s own FCI-G index has tightened a net 24 bps since September 17. The contribution from mortgages and the dollar has collectively delivered about twice that tightening, while equities and the direct (via symbolism) effect of the funds rate decline itself have gone the other way.
Financial conditions do not appear to be restrictive
Official Fed measure is monthly and actual to September. My daily expression of that is actual to Friday’s close.
The more important point, though, is that financial conditions do not appear to be tight, as the cardinal value of the Fed’s index is still negative. That means that financial conditions are on balance delivering a minor impetus. I think the cardinal value is mostly the way to go, but I concede it is complicated. Maybe we are supposed also to look at the change, if – say – we want to extrapolate momentum and wonder about what is behind that momentum. I would say that financial conditions have eased on balance from where they were when influencing the current data flow, i.e., in the recent past.
And away from this, fiscal policy is likely – not certain – to put in some additional impetus going forward. This on two grounds. First, the large federal deficit in level terms implies accumulating stimulus in level terms, by putting upward pressure on r* or the equilibrium level of broader financial conditions. And second, if Trump raises the fiscal deficit, then there will be additional impetus in the more conventional Keynesian sense of the term – and the first effect will intensify a bit. At some point, the markets will protest this on sustainability grounds. And at that point, r* goes down, not up, because the reaction to that signal will be a fiscal tightening, which along with – wider risk premia – would have to be offset by Fed ease. In asserting this high conviction view, I lean on the logic of Ponzi Public Finance and not the Fiscal Theory of the Price Level, which sees fiscal strains leading to inflation, wrongly in my view. In any case, one shock at a time.
I like to emphasize the Fed’s Financial Conditions Index, FCI-G, because I understand the logic of it, have made the effort to make it presentable in real time, and – most importantly – because it is useful rhetorical device to point at folks who overstate the role of r vs estimated r*. But it too is an excessive reduction, just not as bad as r vs r*. Forecasters, including those at the Fed, work up a sense of cyclical momentum in the various components of aggregate demand and then – among other things – incorporate how the exogenous components of various asset price changes might cause that momentum to shift.
The weights within a financial conditions index show how shocks to the relevant asset prices might on average map to the effects on demand growth. That beats using just the funds rate, as I like to emphasize. But context matters here. One bit of context that I like to emphasize is that the most interest sensitive component of aggregate demand, housing, is unlikely to deliver a major shock from here, basically because housing activity is already depressed as evidenced in starts being below their demographically implied pace, and vacancy rates being low, although – in fairness – less low than they were.[2]
But this point is less important than it was, because the FCI-G implies only 8 bps of drag on GDP growth from (I guess implicitly) residential construction and less robust MEW going forward. (In late 2022, the estimated drag there was more than a ½ percentage point.) I will not take the under on that! So, this goes more to the idea that the Fed will not experience a shock from this sector, tilting the economy into recession, than to the idea that financial conditions indexes are somehow overstating the likely drag here along with a case for a lower funds rate. After all, in aggregate, financial conditions imply no drag. If we need some drag, the Fed does not raise the funds rate. As a first pass, it would deliver drag by cutting less than is expected.
The most rates sensitive sector is closer to the floor than ceiling
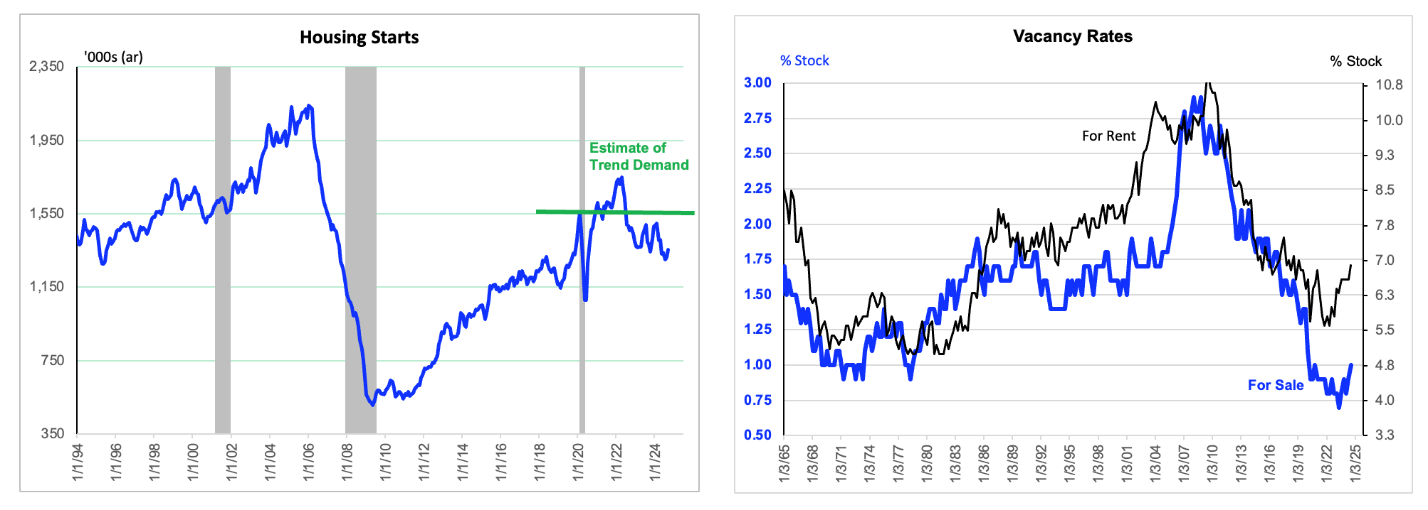
Vacancy data are actual to Q3. Starts data are actual to October. Estimate of trend demand is average of CBO and Harvard estimates, as I read them. Housing starts are reported generally as a 3-month average, although the latest is unsmoothed, and the second latest is smoothed to a 2-month average.
[1] In fairness, Obama’s interventions in bankruptcy law during the GFC were dubious, as conservative friends mentioned to me at the time. And that did not stop the equity return from subsequently being a ten banger. But it is a matter of degree and – in markets — of what is priced
[2] It is tempting to try to relate the recent uptick in vacancy rates to the fact that housing starts were recently running slightly above their demographically implied pace. And getting them down from there, was how the initial Fed tightening took its effects quickly, despite Powell’s repeated – now seemingly mistaken – claims. But my understanding from others who have actually done the work is that the starts, formations, scrappage and vacancy data are not commensurate. They don’t add up. So, rather than trying to reconcile, I would just say starts and vacancies look low, so housing is very probably not overextended.

