

With the CPI and PPI now released for October, we can take a look at what the informed consensus is estimating for the Core PCE Price Index and then draw our own inferences for what that would imply for the measures that seem more important to our sense of underlying inflation and to the nearby Fed outlook.
This month, that process is much less straightforward than typical, because judgment calls – on which reasonable people may disagree – emerge as the tie breaker. But I think I can safely say that this month is shaping up to be somewhere between the concerning print last month and the string of five clearly good prints before that. I expect that Powell will characterize the October data as arguably good enough, but not great, when he speaks at 3:00. That will leave in place the notion that it would take a surprise to prevent a rate cut in December, but I would not go further.
Inflation ex everything looks low enough

Data are implied consensus estimates for October, as inferred by FH
The informed consensus has the Core PCE Price Index rising 27.5 bps during October. All these figures are false precision, but I will skip the rounding to avoid things not seeming to add up. That number is on the firm side, which is why I am no longer inclined to characterize these data as friendly, particularly relative to how the market has internalized the information so far. Not that there has been a huge move, but the substance here is also nuanced.
This month, there have been adds from used motor vehicles, financial services, and the fact that the official data incorporate lagging government measures of average rents, rather than more current measures of marginal or observed rents, as I have been emphasizing. Controlling for those influences, I calculate that the Market Price Only (MPO) version of the Observed Rent Core PCE Price Index is on track to rise 14.5 basis points or at a sequential annualized rate of 1 ¾%. This figure is highly advantaged by stripping out noise. But keep in mind that it has a – presumably fairly steady – downward bias, because non-market prices are not just noisier but have a higher trend inflation rate. So, this measure is consistent with underlying inflation near 2%, sequential, during October. That is okish.
One issue, though, is that while my preferred measure is arguably the single best, I must concede that this month all my judgment calls involved here cut in the dovish direction. And the importance of this is heightened by the fact that my single best measure is ok, not great. So, there is plenty of room for reasonable people to have a slightly more hawkish take. For example, some might argue that the government rent data actually matter at least to some extent or that a 0.3% core unrounded is not going to look great if it prints.
What I take to be the single best measure looks about as good as I suggested yesterday, and fine outright
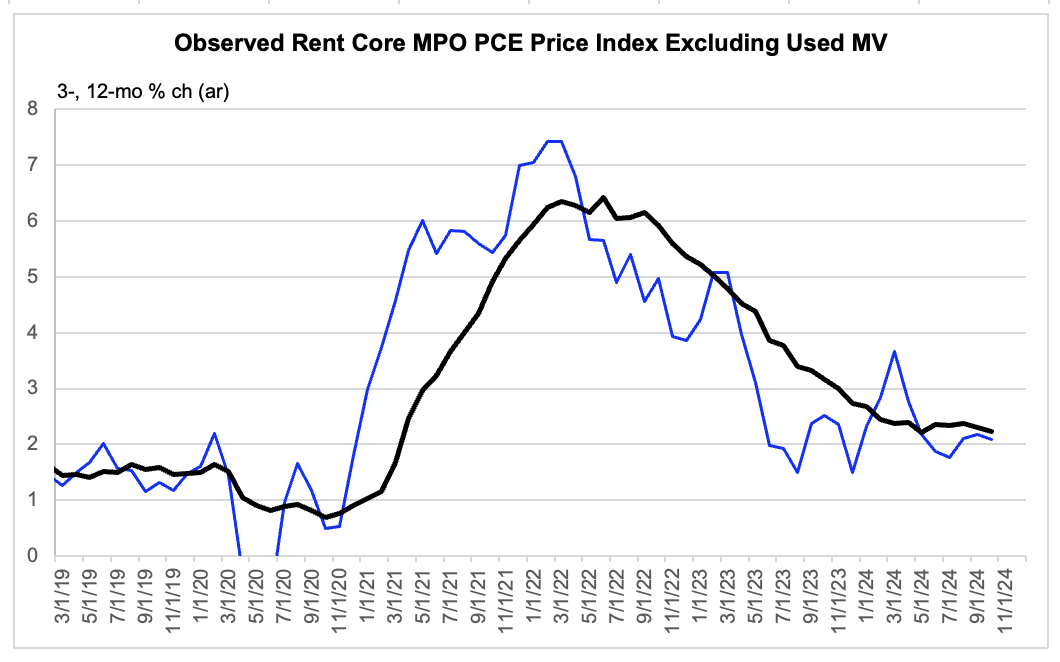
Data are actual to September and FH inference from informed consensus for October.
Separately, the sectoral mix of underlying inflation is slightly adverse for October and for recent months taken in isolation. For example, core goods excluding used motor vehicles is expected to be down 13 basis points while even the MPO version of observed rent core services is expected to be up 23 basis points, which is slightly firmer than would be consistent with the Fed’s target over time. As you can see from the chart below, such a pattern has been developing in recent months. It is not unique to this month, and at the margin we should probably weight services slightly higher than goods, and not just because services have a higher weight. Services are legitimately where the remaining inflation worry is concentrated.
This mix shift is slightly less good than its opposite would be
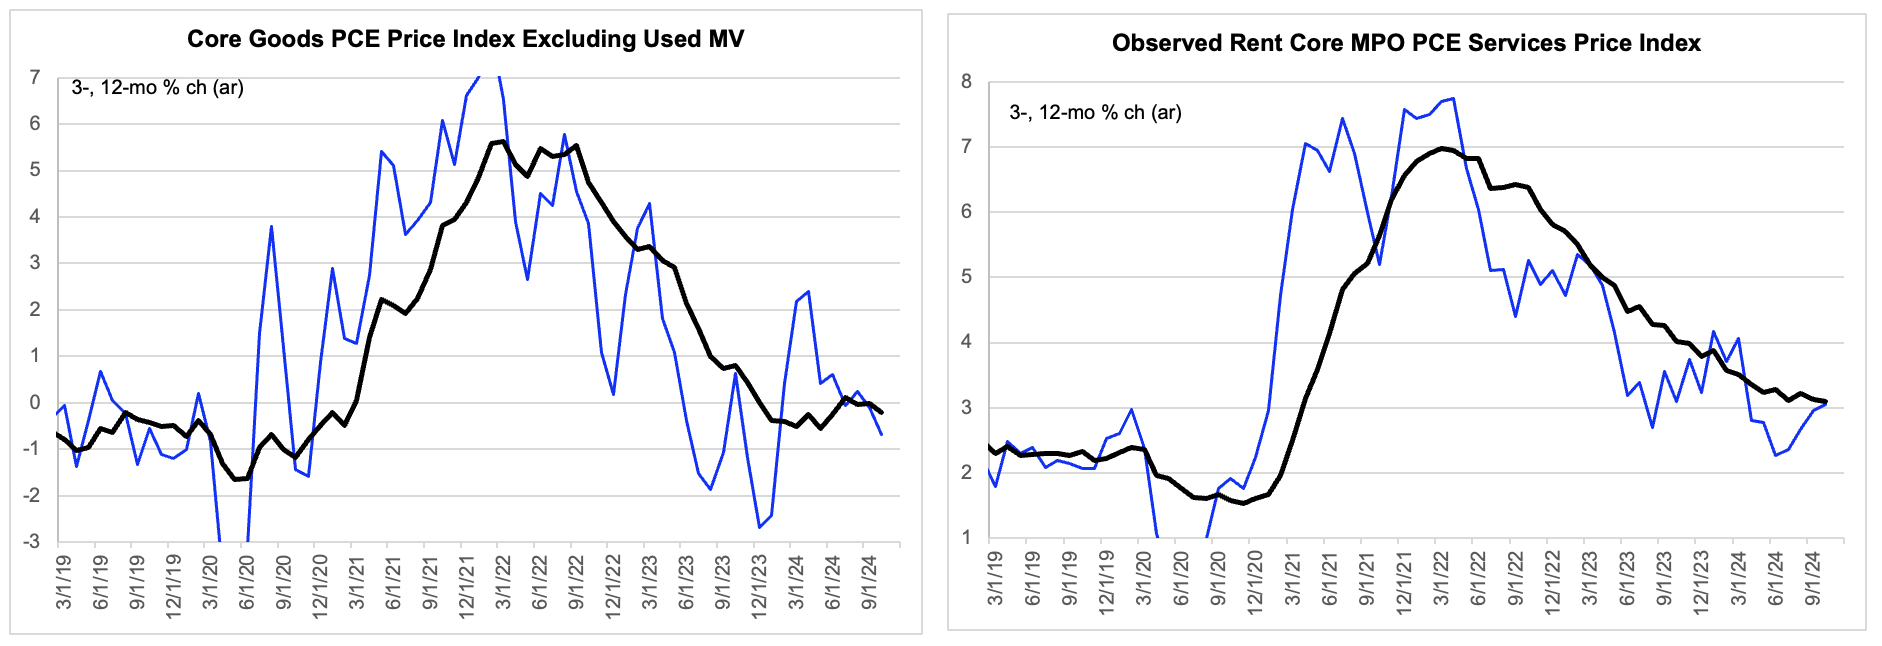
Data are actual to September and FH inference from informed consensus for October.

