

My earlier note focused on how to think about what the news is here. There were a bunch of revisions to both the expenditure and income-based measures of output released just over a month ago. And they have made their way into (our sense of) measured productivity and cost with a timing that is somewhat arbitrary. The substantial “news” here is that productivity growth now looks a bit stronger than we might have judged it a couple months ago. The rest is sort of fun to understand to show off your objectivity credentials. But it does not amount to much.
This note follows up with a take on what is actually going on here in outright terms, as opposed to the timing or substance of the news. The 4-quarter change of unit labor costs looks reasonably perky, as the top panel of the chart below shows. However, that is mostly because of the income just found for 2024 Q1, not to imply that that does not count. I will get to that in a second. But the 2-quarter growth rates shown in the lower panel gives a better sense of what is happening very recently.
Incidentally, my use of “net” in the chart title is meant to signal that the implicit “units” are converted from gross to net, by subtracting out depreciation, which is part of gross value added by income for nobody. That does not matter at short horizons or when looking at short-run growth rate even over long periods. But the issue does accumulate in level terms, which is relevant when thinking about, say, profit margin mean reversion, about which I am not a fan. In any case, I like to use just one measure, so it might as well be the right one.
They measure AHC growth at 9.3% (ar) for Q1

Data are actual to Q3, although depreciation charge (change) is estimated, which will not introduce any meaningful error.
I mention this because I am assessing the Productivity and Cost report released this morning. But in all fairness, the Productivity and Cost report data are probably not the best source of information on underlying trends in cost. The problem is that productivity is very volatile, and best considered a residual in the short term, and that Average Hourly Compensation (AHC) including lumpy payments.
Here is the better way to think about this, which is conventional. I am not claiming to have any special insight here. We start with our sense of what underlying productivity growth is. I think it is 1 ½%. I concede that is arbitrary, but I bet the consensus among those paying attention will be within 25 bps of that! Then we use data that are not from the Productivity and Cost report to get a sense of what the underlying trend of compensation growth is. The ECI and Wage Tracker are good places to start for that. The October Wage Tracker released yesterday suggests that Wage growth is running at about 4 ¼%, on their concept. Their concept picks up the effect of normal career advance, because it follows people not jobs, so it has an upward bias of about 75 bps relative to the ECI. But the ECI misses the employment mix shift that is partly the driver of aggregate productivity growth. The net net is that 4 ¼% growth in the Wage Tracker suggests underlying AHC growth of perhaps 4%. That maps to ULC growth of 2 ½%, which looks a bit firm, but not alarming. I pay much more attention to the pace of wage growth than to its rate of change, for reasons I have been over. But the rate of change has been negative for long enough now that the level is no longer that big a deal. So, this is a faint yellow flag for the Fed, not a major issue.
Incidentally, the issue for the Fed is that inflation on the goods and services side is no longer collapsing and the behavior of the real economy keeps falsifying their weird claim that policy is tight and about to hit demand. My sense is that that demand things is wrong. But reasonable people can disagree. It is true that the unemployment rate rose for a bit there which might mean policy was tight at some point. What is striking is their misplaced confidence. In fairness, this is a good problem to have. I heard people wondering if Powell might get sucked into a discussion of how the election has changed the lay of the land. I bet he demurs and goes right down the middle: why they eased and how they are inclined to go again but along a slope that will be determined by the data.
Underlying AHC growth now looks to be 4%, which is finally almost low enough
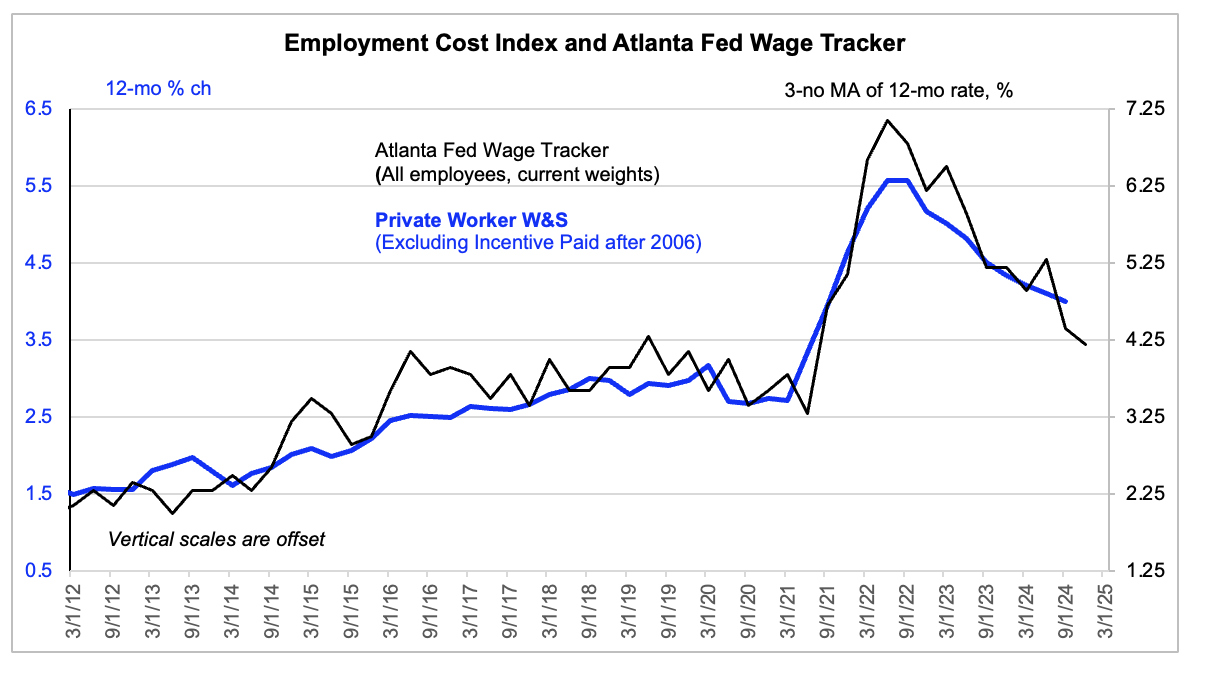
The ECI and Wage Tracker are both monthly observations, although the ECI is released quarterly.. Accordingly, the data are expressed at quarterly frequency, with the Wage Tracker converted to quarterly using the last observation for the quarter. The exception is the October value which is for now penciled into Q4. ECI is actual to September, presented as Q3.

