As we head into the final few trading months of the year, I believe the setup for small caps (IWM) to breakout and outperform the major indices looks very attractive and suggest using options to position for that possibility. First, let’s look at some of the reasons why I think it may be time for IWM to not only breakout, but to also outperform:
1. Market continues to broaden out away from just the “Magnificent 7” leaders
Since peaking in July, the Mag 7 index has significantly underperformed the rest of the market. This broadening of the market is a theme that 22V has repeatedly been stressing for the last few months and continues to favor. This rotation can clearly be seen when we overlay that Mag 7 index to both the SPX as well as the Equal-Weight index (RSP). In fact, of the 7 stocks in the Mag 7, only META has been able to eclipse the July highs (and that is with the SPX making new highs). This rotation away from the mega cap names as the overall market stays bid supports other areas of the market and should help the small caps. Lastly, recall it was during earnings season in July where we saw the sharpest rotation out of tech and into small caps. Between July 10th and July 30th we saw IWM rally 9.44% AND tech (QQQ) decline by over 9%. Earnings season for the mega cap tech names starts in the next few weeks and should we see a similar-type of rotation away from the tech names that is likely to boost IWM once again.
The Mag7 index (white) continues to lag both the SPX and equal-weight since peaking in July

2. Start of bank earnings season started off very positive on Friday
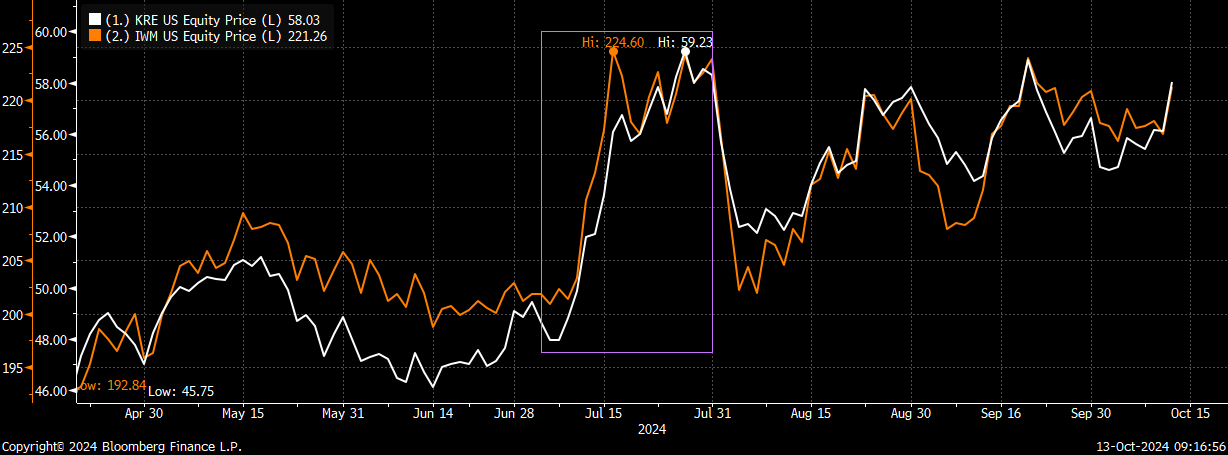
Large cap bank earnings season kicked-off on Friday and we saw very positive reactions from WFC (+ 5.6%) and JPM (+4.4%). These moves helped lift the regional bank index (KRE) by 3.5% and the larger financials etf (XLF) by 1.93%. Banks/financials are the largest component of IWM at nearly 20%, and any strength/outperformance by that sector goes a long way towards helping IWM outperform on both an absolute and relative basis. Look at the move in KRE in July when IWM was sharply outperforming both QQQ and SPY (chart below).
IWM had its biggest move higher when banks (KRE) were outperforming in July
3. Bonds are oversold. Any bid/strength in bonds should be supportive to small caps
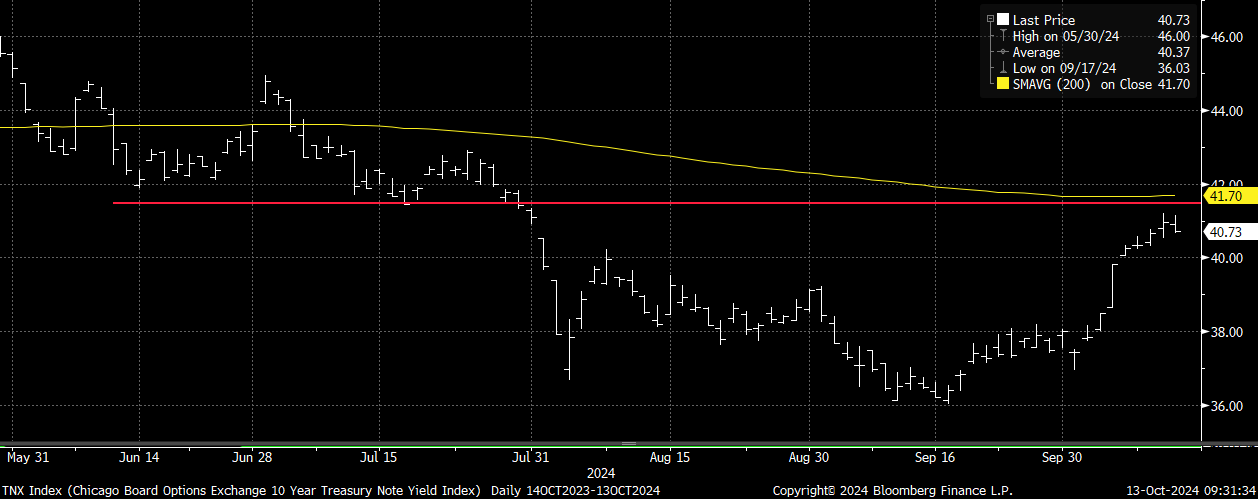
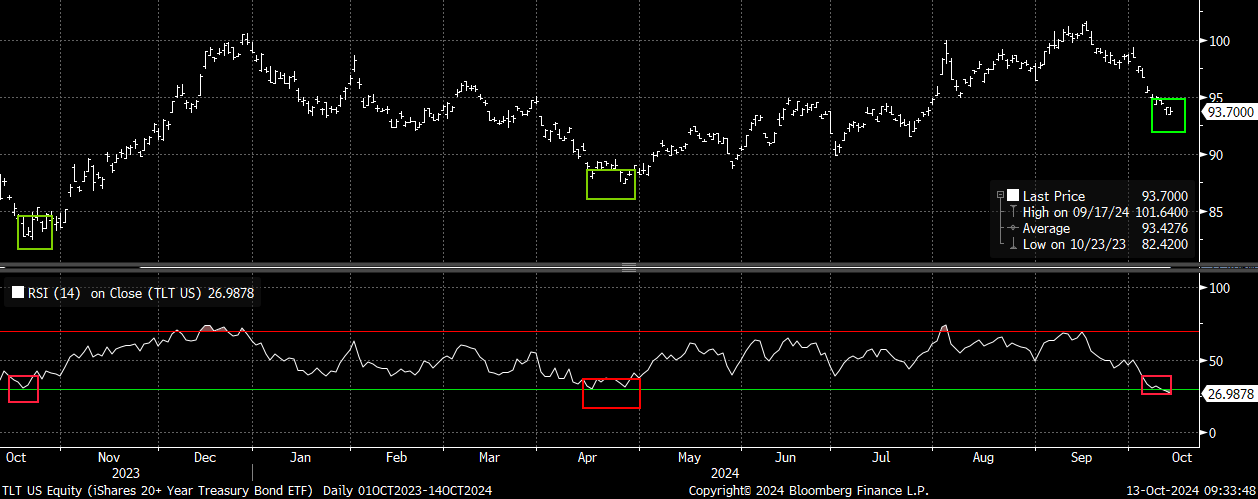
Since bottoming on 9/17, 10-year yields have climbed from 3.6% to ~ 4.1%. This rise in yields has likely been a function of recession odds moving considerably lower as economic data continues to come in strong (as the Fed has started cutting rates). Rising yields because of strong data/economy is supportive to owning/buying the cyclical small caps, yet the markets knee-jerk initial reaction is usually to sell the group on fears that higher yields are a headwind for the group. That being said, the sharp selloff in bonds the last few weeks has now moved them to oversold (see TLT chart below). Should we see bonds stabilize and start to move higher (yields lower) that should also help with sentiment for the small caps.
10-year yields have moved up from 3.6% to 4.1% and now sit right below major resistance
Longer-duration bonds (TLT) just registered an “oversold” reading for only the 3rd time in a year. Previous two times marked bottoms
4. Attractive technical setup and favorable seasonality for IWM
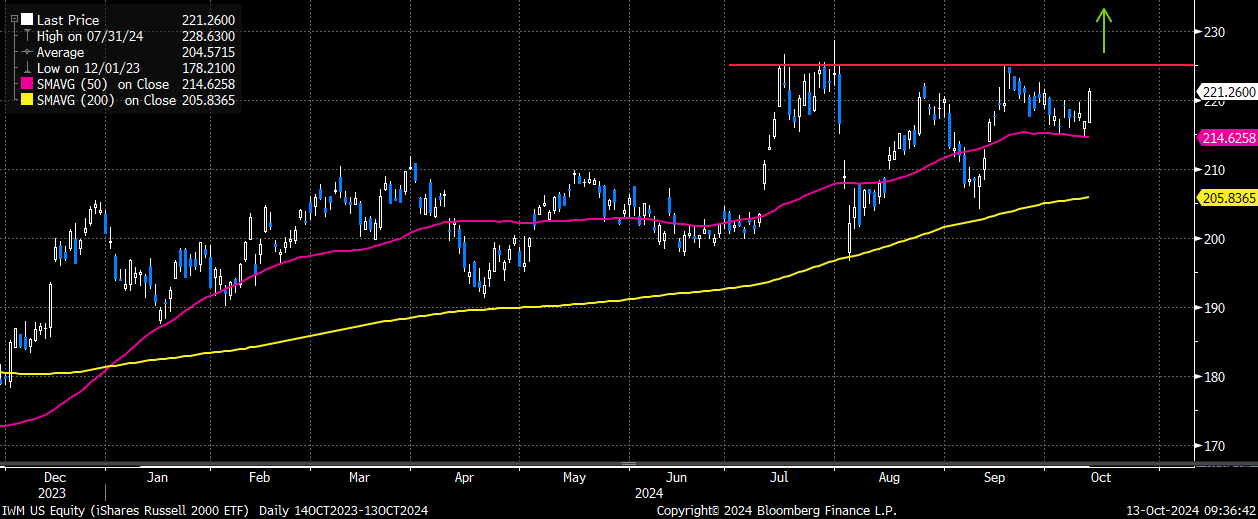
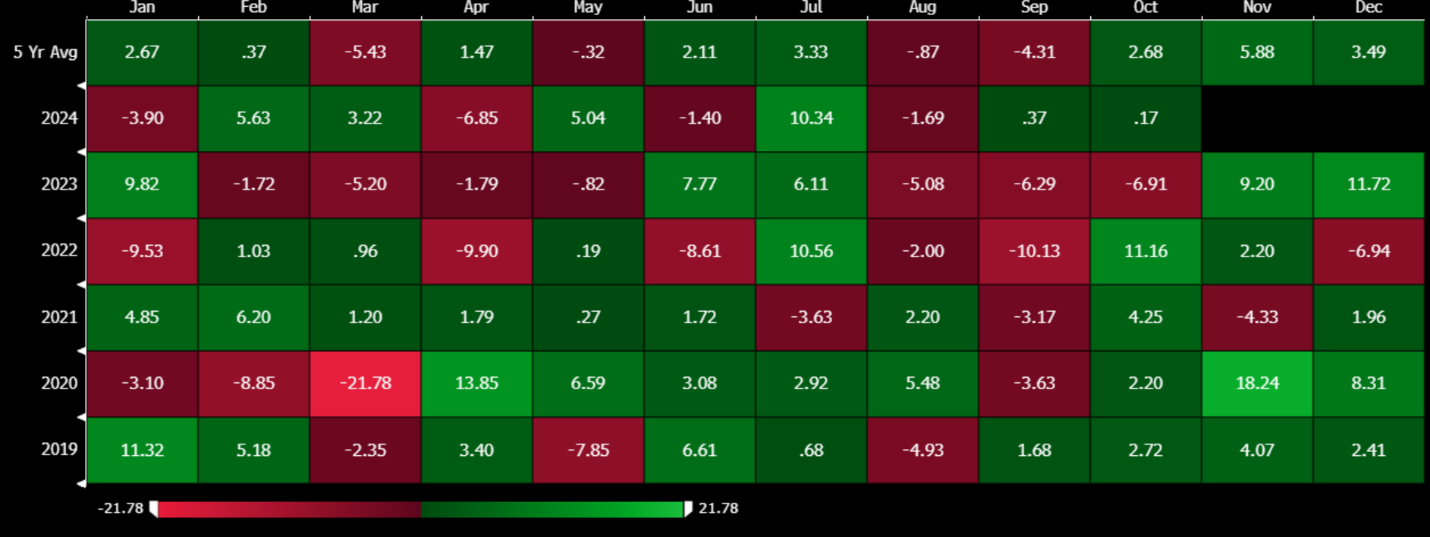
IWM has remained above its 200-day moving average since last December. Even on the sharp drop in early August, it was able to hold that support. On the latest pullback between mid-September thru early October (likely on higher yield concerns) the pullback was only to the 50-day moving average support (a much shallower decline). IWM is now only ~ 2% below the well-defined resistance level of 225 (the July and September highs) and given the markets broadening out and continued bid, a breakout above that resistance level seems much more likely now (especially with November and December being the two best months for IWM over the past five years – see chart below)
IWM has held its 200-day moving average since December and on the latest pullback also held the 50-day. Now targeting a breakout above the 225 area
November and December have been the best two months for IWM over the past five years
Given this setup, here is my preferred trade to play for a breakout in IWM and meaningful move higher thru the end of the year:
Sell IWM Dec 205 Put (22-delta, 25.5 implied vol)
Buy IWM Dec 230 Call (39-delta, 21.9 implied vol)
Costs ~ $2.30 (IWM 221.26 ref)
Trade Details:
- Selling the 7.4% downside put (which is also at the 200-day moving average and the Sept lows) to buy the less than 4% upside call
- 3-month put/call skew is just below the highs (puts trading rich to calls), so with implied volatility elevated favor selling puts to own upside calls
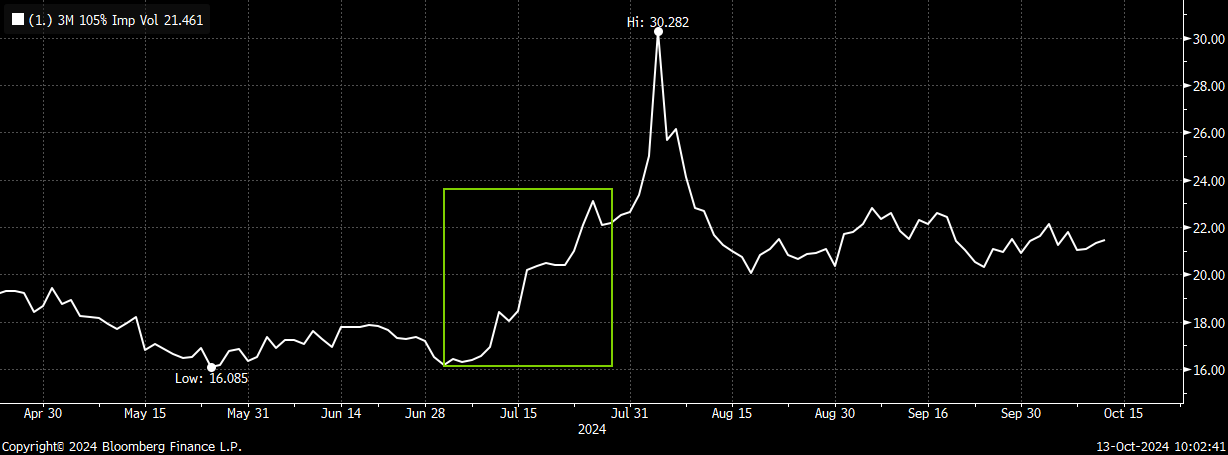
- On the sharp rally in July (breakout above the March/May highs) we saw upside call volatility explode higher into the move – why I want to own calls outright and not an upside call spread
3-month 25d put skew to 40d call skew just below the highs
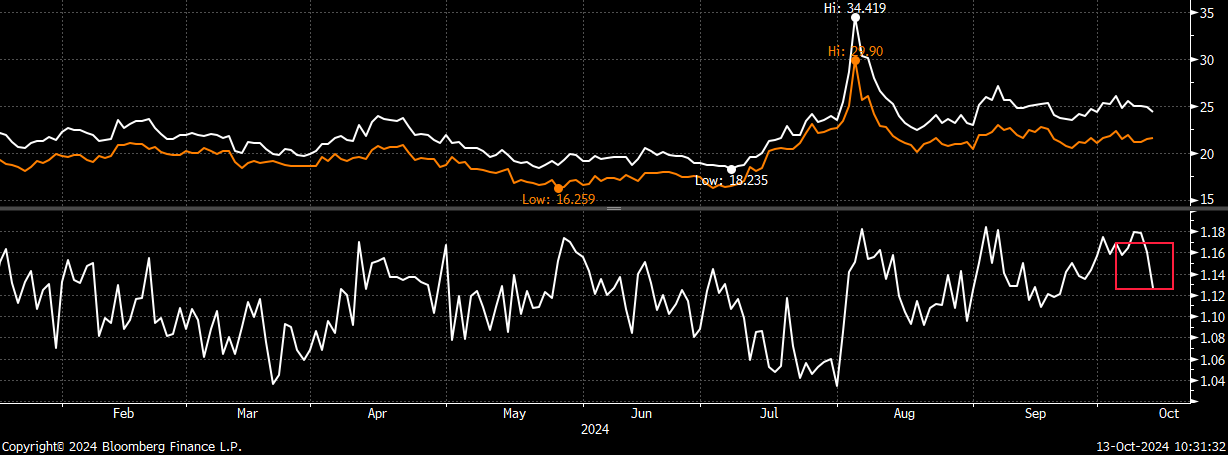
Back in July when we saw IWM move higher we saw upside call implied volatility also spike higher (even before the vol event in early August on the mkt selloff)