SUMMARY
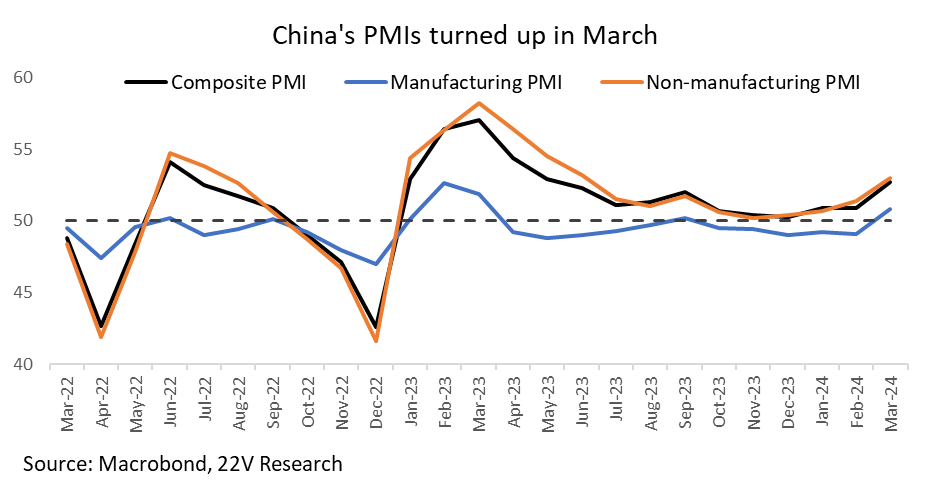
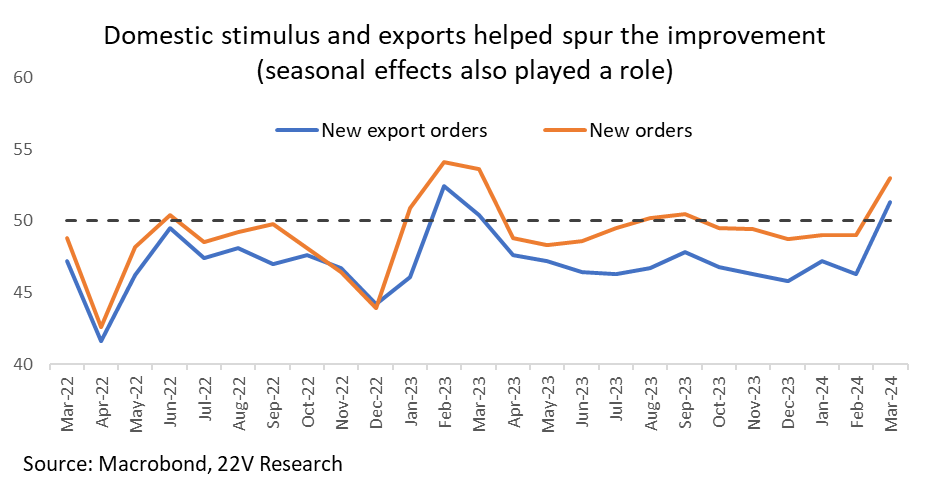
- The improvement in China’s March PMI readings reflects domestic stimulus, strong exports, and seasonal effects from the timing of the lunar year holiday
- While the better readings are welcome, the PMIs also imply a continued imbalance between strong supply-side growth and anemic domestic demand, especially household consumption
- Such dynamics make China’s recovery dependent on Beijing’s ambiguous commitment to additional stimulus, hold back a strong rebound in nominal economic growth, and threaten to escalate trade frictions
China’s official Purchasing Managers Index (PMI) readings for March beat consensus expectations and were notably higher than in February. The manufacturing PMI came in at 50.8 (up from 49.1 in February), moving above the expansion/contraction line for the first time since September 2023. The non-manufacturing PMI improved to 53, from 51.4 in February, led by construction activity (56.2, from 53.5 in February); services activity ticked up to 52.4 from 51 in February. The composite PMI improved from 50.9 in February to 50.9 in March.
The reported improvement seems mainly due to these factors:
- Domestic stimulus as recent monetary/credit easing and fiscal spending (especially infrastructure) has cumulatively taken effect.
- Improved exports. New export orders jumped from 46.3 in February to 51.3, with strong PMIs in export-oriented industries such as furniture, chemicals and electronics.
- Seasonal effects. The late timing of the Lunar New Year in February likely exaggerated the improvement in March, when workers returned from holiday and production resumed. Construction projects also restarted after heavy snowfall in February.
Yet it is early to conclude that China’s recovery is on strong and sustainable footing. One should always be circumspect about over-interpreting the PMIs, which are a diffusion index rather than a measure of levels of activity. The release of China’s Q1 GDP and March activity data on April 16 will provide a much more comprehensive view of the state of the recovery. Still, it is worth commenting on the PMIs, especially given that they follow January-February data (released March 18) that showed notable strength in industrial production and investment. The tendency by some observers (especially headline writers) will be to assume that China’s recovery is finally gaining traction.
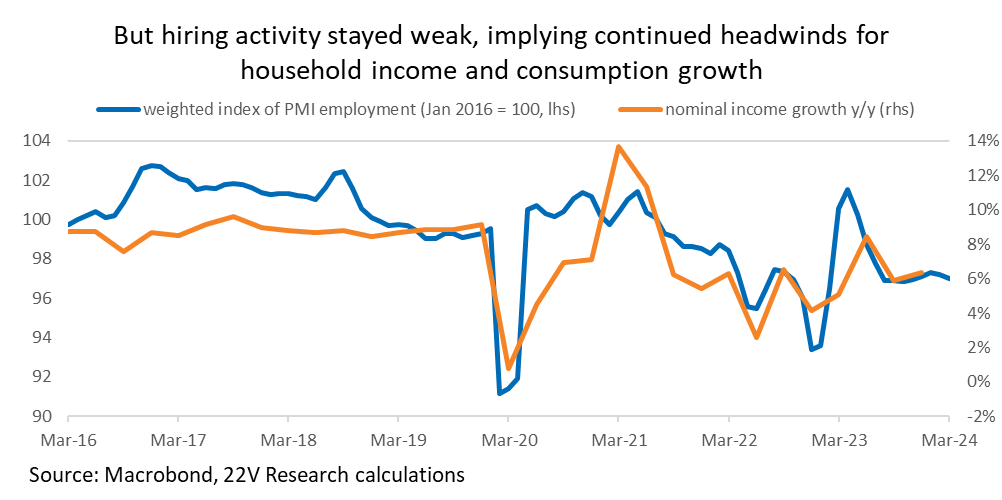
The PMIs do not challenge the recent pattern for China’s growth: expansion on the supply side, contrasted with subdued domestic demand – particularly consumption. In the Jan/Feb activity data released earlier this month, manufacturing production expanded by 7.7% y/y (up from from 7.1% in December), while manufacturing investment accelerated to 9.4% y/y (up from 6.5% in 2023 as a whole). By contrast, consumption growth continued to lag the supply side: growth of nominal retail sales slowed to 5.5% y/y in Jan-Feb (down from 7.4% y/y in December), with sales of goods (as opposed to services) up 4.6% y/y (from 4.8% in December). We have emphasized that a key reason for the weakness in consumption is anemic hiring by firms, which has caused household income growth to lag well below the pre-pandemic trend. Dormant property sales are another big factor.
The PMI provide only a partial reading, but imply that these broad dynamics continued in March:
- Employment sub-indexes from all three PMI series (manufacturing, services and construction) show that job growth remains weak. Further below that we update a favorite chart, which shows the PMI employment data and its link to household income. Anemic hiring implies that income growth, and with it household consumption, will continue to lag.
- The manufacturing PMI’s producer prices sub-index weakened in March (47.4, from 48.1) implying that manufacturers continue to have little pricing power and that deflationary pressures persist. The sub-index is a decent leading indicator for the official PPI (see chart below), which has been in deflation since late 2022.
- While detailed data are not available, commentary by China’s statistical bureau spokesperson on the release implied that the uptick in the services PMI came from areas linked to production (e.g., postal services, telecom, transport and finance) rather than consumption. The PMI for catering services, the proxy for dining out, was in the contractionary range in March – suggesting that household spending on entertainment dropped off quickly after the lunar new year holiday.
Ongoing weakness in consumption and private sector demand matters for three key reasons:
- Dependence on stimulus. China’s PMI also perked up in March of last year, only to soon turn down as the momentum from the Covid pivot and a brief recovery in real estate activity faded. This year, the key issue is that private sector demand remains subdued due to the deterioration in real estate activity and cautious spending by households. While exports are providing support to growth (and spurring trade frictions, as noted below), the recovery remains highly dependent on stimulus. The annual National People’s Congress was underwhelming in that regard, with the leadership showing only a modest degree of urgency to boost demand amid a primary focus on industrial modernization (see our write-up HERE). While fiscal spending is off to a decent start in 2024 due to funding already in the pipeline, additional stimulus – beyond what was specified at the NPC – will likely be necessary to offset ongoing weakness in property. Beijing’s willingness to provide that support on a timely basis in coming months is unclear. Indeed, the recent strength in economic data – even if due to the supply-side – probably puts Q1 GDP growth on track for the government’s 2024 GDP target of “around 5%.” That will likely further reduce the leadership’s sense of urgency to add more support for growth in the near term, even though underlying demand remains soft.
- Weak nominal growth, which is negative for Chinese equities. With production strong but end-demand weak, deflationary pressures seem likely to persist – continuing to hold back growth of nominal GDP and corporate revenue and earnings growth. Deflationary concerns have been the main macro for Chinese equities and this is unlikely to subside soon.
- Growing trade frictions. While perhaps less immediately relevant for markets than the two factors above, it is worth highlighting the extent to which international concerns over China’s production and export strength – and charges of excess capacity – are escalating. See for example US Treasury Secretary Janet Yellen’s speech last week on this topic (link HERE), which comes on top of the EU’s investigation of China’s subsidies in the electric vehicle sector. Even Brazil, not known for trade confrontation with China, is angry (FT link HERE). We will have more in-depth treatment of these dynamics in a forthcoming report, but the key point here is that – as several prominent Chinese economists are warning – Beijing’s focus on manufacturing investment and under-attention to domestic demand risks provoking new protectionist measures that limit the extent to which China can rely on exports as a release valve for domestic overcapacity.
In short, what are looking for in forthcoming March data, and over coming months, are signs that domestic demand is gaining traction. The key indications would be an improvement in consumption backed by stronger job and income growth, and signs that property activity is finally bottoming out. Beijing’s manufacturing-focused stimulus strategy is thus far not taking comprehensive measures in either of these two areas, which is a key reason we remain cautious about China’s broad macro outlook, particularly for equities.
Finally, it is also worth noting a provocative and timely analysis by economists at the New York Fed that examines implications for the US economy if China “manufactures a sugar high” through its aggressive support for the industrial sector (link HERE). The Fed authors define this scenario as production-intensive GDP growth of 6% over the next two years, an upside scenario that serves as the counterpoint for their companion piece (also worth reading) that looks at a downside scenario of worsening real estate spillovers in China (link HERE). They conclude that the “sugar high” scenario “could generate persistently higher inflation in the U.S. over the next two years” due to the impact that surging manufacturing activity in China would have on prices for global commodities and intermediate goods. I am not skeptical of the counter-intuitive finding on US inflation but see a low probability of the 6% growth scenario taking place given how much stimulus it would entail to offset the lost activity from the property sector. This amount of credit support for manufacturing would pit Xi’s obsession with industry against his determination to limit financial risks.