Back Economics

Core inflation and real PCE both better

Published on March 29, 2024

∙ Download the PDF Report

By

Gerard MacDonell

This morning’s core inflation data for February were more benign than expected and perhaps by a wider margin than may be obvious.  The overall core was up 26 basis points, which is just slightly lower than what I had factored in as the unrounded consensus.  More to the point, though, the proximity of the core to the consensus was driven in large part by a fluke, as nonmarket prices not related to portfolio management added to the standard core.  The Market Price Only (MPO) component of the core deflator was up just 23 basis points.

Core deflator ex-everything

Source: BEA, FH calculations, including inferences of what the informed consensus has for the underlying detail.

Data are actual to February. 

Moreover, the effect of that lower figure on core services, which Powell has recently been highlighting, is leveraged. The reason is that core goods prices were up slightly more than the high 30 basis points expected. As a result, the MPO version of the Powell supercore was up just 10 basis points on the month.   This is outright good news, not just less bad than expected.  One month does not make a trend, as the gain last month was 58 basis points and the 3-month rate of change here is arguably still in an uptrend.  But the newsthere this month was in fact friendly. 

Less bad is better than more bad *
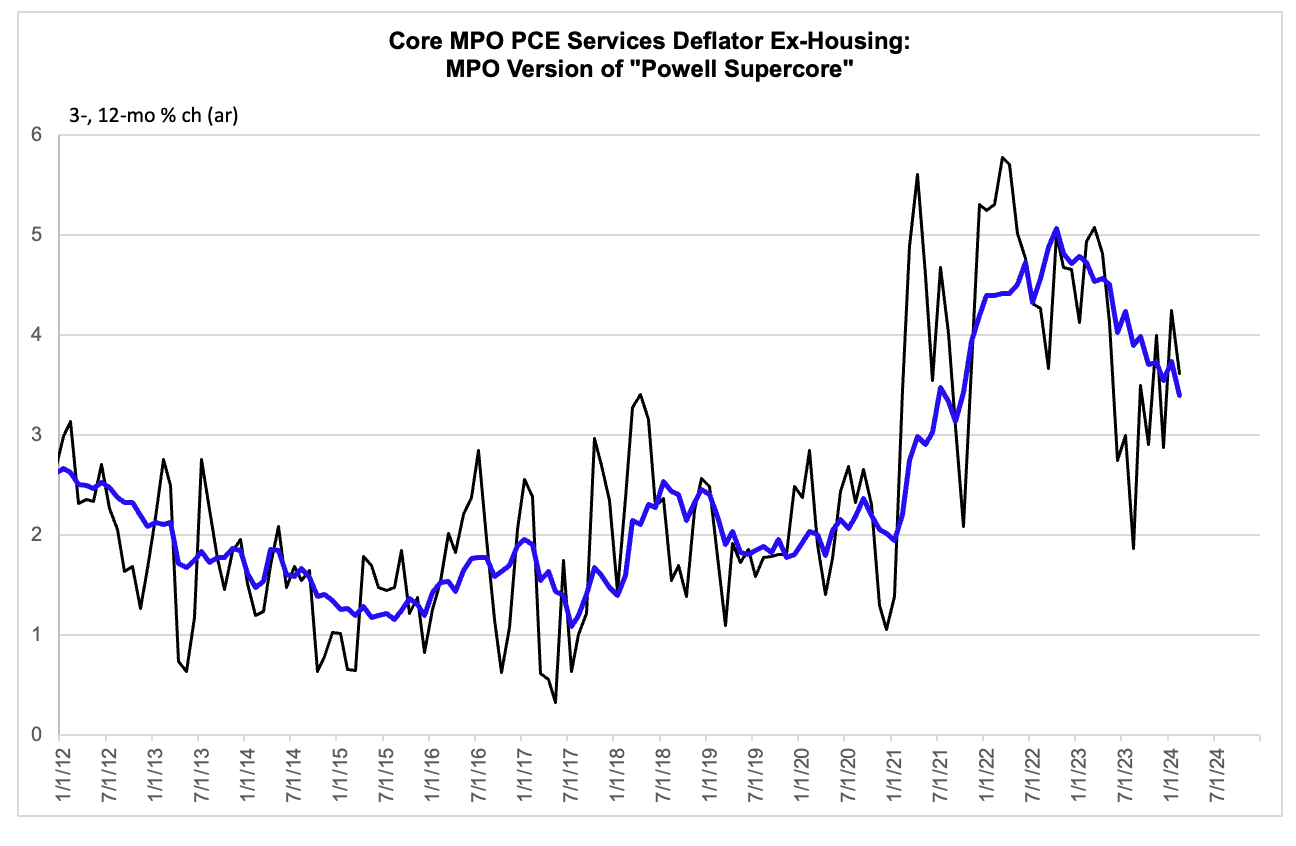
Source: BEA, FH calculations

Data are actual to February.

Meanwhile, real PCE beat handily on the month and implies that the real PCE growth is tracking closer to 2 ¼% for Q1 than to the 1 ½% I had previously “modeled,” at some risk of using too big a word.  The gain of (mostly) goods consumption was closely in line with what was implied by the retail trade report and auto SAAR for February.  But the services component representing 60% of PCE that is not informed by data released ahead of time was up a very strong 65 basis points, explaining the beat.  There were also revisions in the back data, but the effect of them on the bean count is small relative simply to the beat this month.  Somewhat related, the underlying trend of real PCE growth, looking entirely backward, is a slightly different calculation than the quarterly tracking, which can be affected by arbitrary base effects. It looks like that underlying trend is around 3%, which is also stronger than how things seemed previously.

One issue looking forward is that real income growth has recently been weak.  This in combination with strength on the consumption side has allowed the saving rate to tick down again.  For reasons I will get to once I have had time to deal with the BEA’s arbitrary changing of units again this month, we should never reason from the level or recent history of the measured personal saving rate.  But the weaker income growth is worth taking note of, and I will do so in a follow up note. 

* Larry David has called this the Obama Doctrine.

—

Information provided by Front Harbor LLC has been obtained from sources believed to be reliable, but is not necessarily complete and its accuracy is not guaranteed. No claim is made regarding the fairness, accuracy, completeness, or correctness of the information and opinions contained herein. Views and other information provided here are subject to change without notice. All reports produced by Front Harbor are issued without regard to the specific investment objectives, financial situation or particular needs of any specific recipient and are not to be construed as a solicitation or an offer to buy or sell any securities or related financial instruments.  Predictions, forecasts, and estimates for any and all markets should not be construed as recommendations to buy, sell, or hold any security or fund.  The analyst authoring reports from Front Harbor may have positions in some of the securities discussed here.


DISCLOSURES AND DISCLAIMERS

Analyst Certification

The analyst, 22V Research Group, primarily responsible for the preparation of this research report attests to the following: (1) that the views and opinions rendered in this research report reflect his or her personal views about the subject companies or issuers; and (2) that no part of the research analyst’s compensation was, is, or will be directly related to the specific recommendations or views in this research report.

Analyst Certifications and Independence of Research.

Each of the 22V Research analysts whose names appear on the front page of this report hereby certify that all the views expressed in this Report accurately reflect our personal views about any and all of the subject securities or issuers and that no part of our compensation was, is, or will be, directly or indirectly, related to the specific recommendations or views of in this Report.

22V Research (the “Company”) is an independent research provider. The Company is not a member of the FINRA or the SIPC and is not a registered broker dealer or investment adviser. 22V Research has no other regulated or unregulated business activities which conflict with its provision of independent research.

22V Research, LLC is a professional services and independent publication organization. 22V Research, LLC is not a securities broker-dealer, not a member of the Financial Industry Regulatory Authority (FINRA), not a registered investment advisor (RIA) and not a member of SIPC.

Securities transactions, when offered, are offered by 22V Securities, LLC through LPS Capital, LLC. Certain employees of 22V Securities, LLC are dually registered as securities representatives of LPS Capital, LLC or Analyst Hub Securities, LLC. 22V Securities, LPS Capital and Analyst Hub Securities are members FINRA, SIPC.

https://brokercheck.finra.org/

Current Ratings Definition.

SECTOR OUTPERFORM: An “outperform” rating anticipates the company will outperform the S&P Regional Banking Index (peer group).

SECTOR PERFORM: A “market perform” rating anticipates the company will perform in line with the S&P Regional Banking Index (peer group).

SECTOR UNDERPERFORM: An “underperform” rating anticipates the company will underperform the S&P Regional Banking Index (peer group).

Limitation Of Research And Information.

This Report has been prepared for distribution to only qualified institutional or professional clients of 22V Research Group. The contents of this Report represent the views, opinions, and analyses of its authors. The information contained herein does not constitute financial, legal, tax or any other advice. All third-party data presented herein were obtained from publicly available sources which are believed to be reliable; however, the Company makes no warranty, express or implied, concerning the accuracy or completeness of such information. In no event shall the Company be responsible or liable for the correctness of, or update to, any such material or for any damage or lost opportunities resulting from use of this data. Nothing contained in this Report or any distribution by the Company should be construed as any offer to sell, or any solicitation of an offer to buy, any security or investment. Any research or other material received should not be construed as individualized investment advice. Investment decisions should be made as part of an overall portfolio strategy and you should consult with a professional financial advisor, legal and tax advisor prior to making any investment decision. 22V Research Group shall not be liable for any direct or indirect, incidental or consequential loss or damage (including loss of profits, revenue or goodwill) arising from any investment decisions based on information or research obtained from 22V Research Group.

Reproduction And Distribution Strictly Prohibited.

No user of this Report may reproduce, modify, copy, distribute, sell, resell, transmit, transfer, license, assign or publish the Report itself or any information contained therein. Notwithstanding the foregoing, clients with access to working models are permitted to alter or modify the information contained therein, provided that it is solely for such client’s own use. This Report is not intended to be available or distributed for any purpose that would be deemed unlawful or otherwise prohibited by any local, state, national or international laws or regulations or would otherwise subject the Company to registration or regulation of any kind within such jurisdiction.

Copyrights, Trademarks, Intellectual Property.

22V Research Group, and any logos or marks included in this Report are proprietary materials. The use of such terms and logos and marks without the express written consent of 22V Research Group is strictly prohibited. The copyright in the pages or in the screens of the Report, and in the information and material therein, is proprietary material owned by 22V Research Group unless otherwise indicated. The unauthorized use of any material on this Report may violate numerous statutes, regulations and laws, including, but not limited to, copyright, trademark, trade secret or patent laws.