

Peter pointed out earlier today that one interesting element of the updated National Accounts data is that they show real GDI rising more quickly than GDP for the first time in five quarters. The Q4 gap there is 145 basis points (ar). And it means that the statistical discrepancy separating GDP from GDI has closed from a (pre-revised) 255 basis points in Q3 to 202 basis points in Q4. So, the statistical discrepancy remains an issue, but less so, and mostly by virtue of differential growth rates prior to the second half of 2023. Taken in isolation, this implies a little more momentum on the growth side.
One contribution to the stronger GDI figures is that corporate sector output is stronger in recent quarters. For example, nominal gross value added in the nonfinancial corporate sector has quickened (monotonically) from a reported 1% in the fourth quarter of 2022 to 7.7% in the fourth quarter of this year. Swings of gross value added almost invariably have a leveraged effect on profits, which are the relatively small difference between value added and direct costs, which tend to be sticky. As a result, before tax nonfinancial profits were up 5.2% (not annualized) during Q4. And this was the main driver of global before tax profits, which were up 4.1%. After-tax profits were up similarly, as shown in the left panel of the chart below.
Value added spikes go first into margins

Source: BEA, Federal Reserve Bank of St. Louis (FRED), FH calculations
Data are actual to Q4.
Profit margins are most easily measured and interpreted in the domestic nonfinancial corporate sector, as depicted in the right panel of the chart above. In the interest of simplicity, I no longer adjust these margins for the flow and ebb of Covid-related government subsidies to the corporate sector, as they have not been a major issue recently. But just keep in mind that the wild swings just after the Covid shock were partly noise. During the past couple years, the underlying trend of margins has been a narrowing one, although one progressing at such a shallow pace that it seemed unlikely to be a major consideration for equities, which would keep off recession risks and what the Fed is up to. My own mistake was in understating the relevance of the actual drivers.
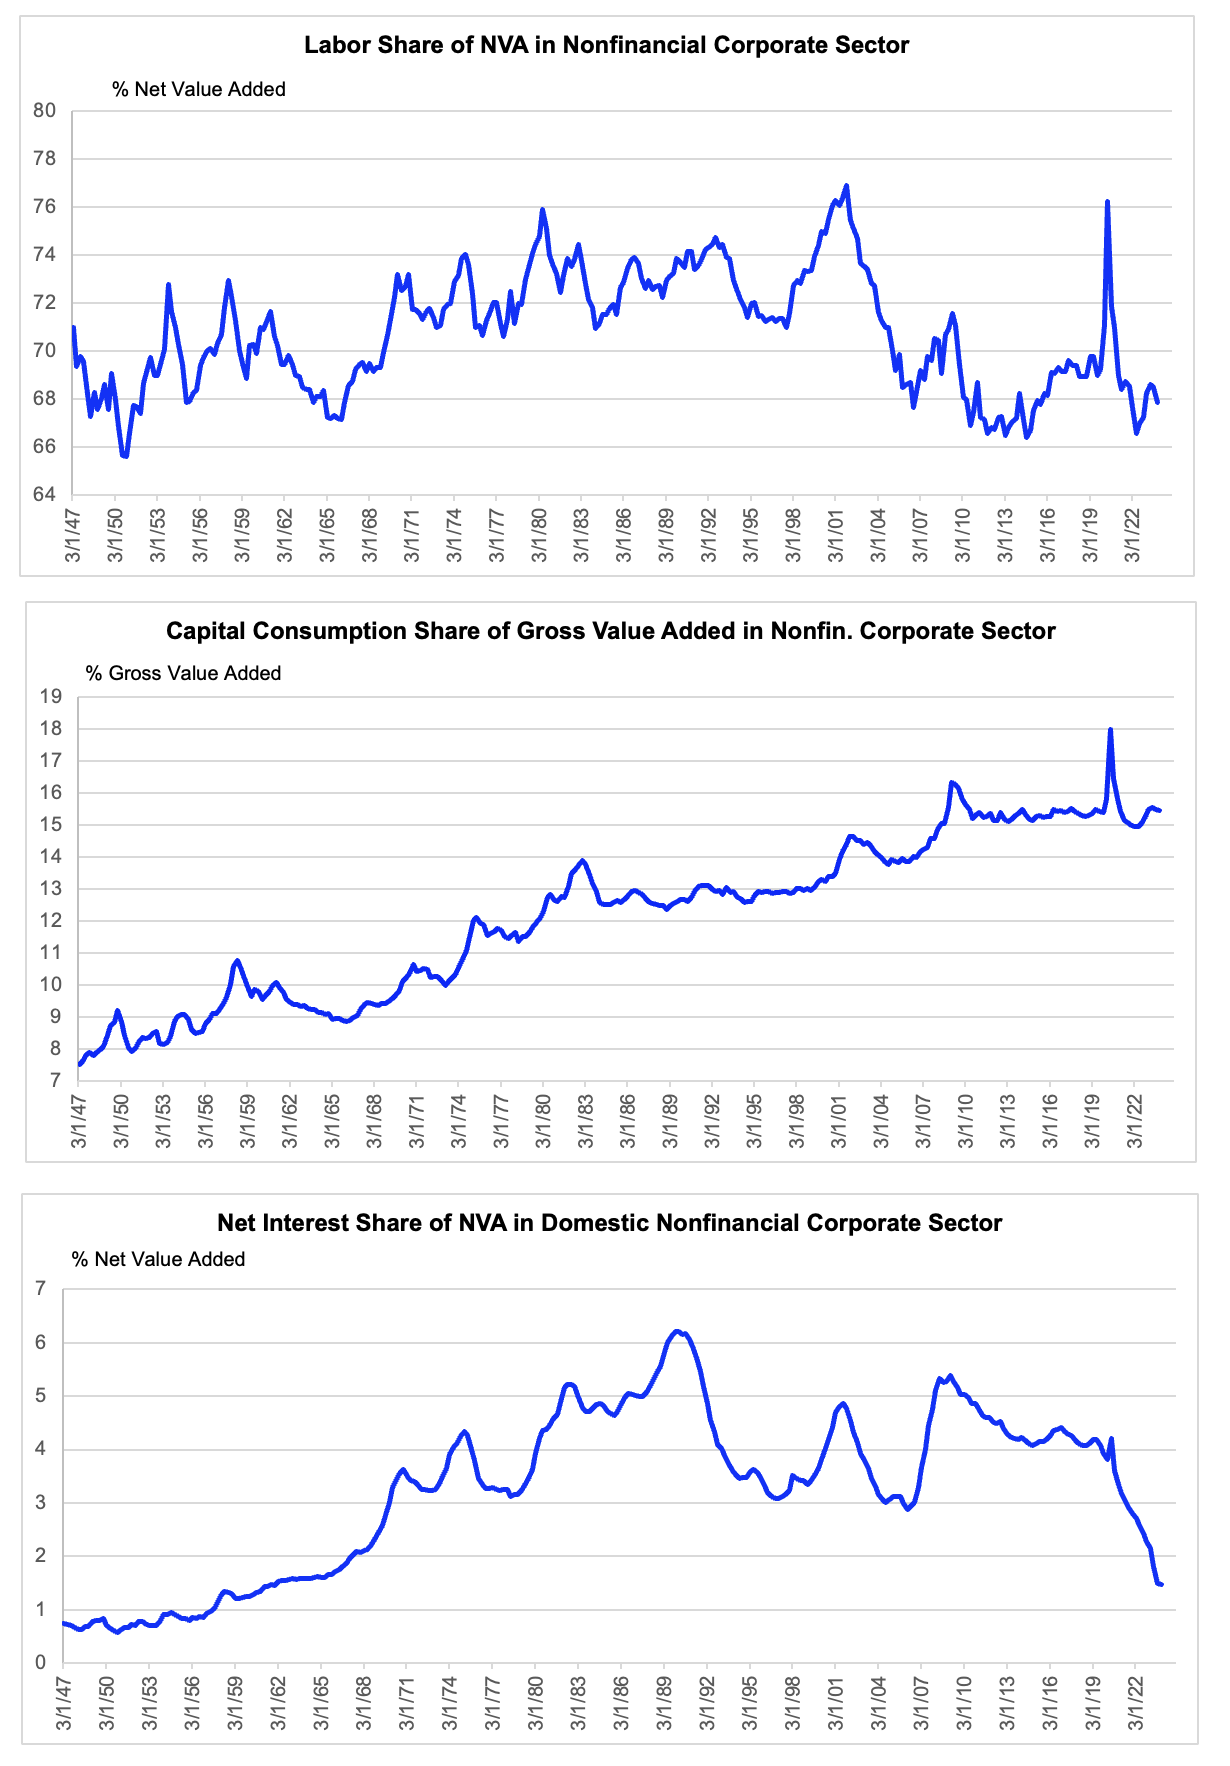
The spike of margins during the fourth quarter reflected pronounced and unsustainable strength in nominal value-added growth, as mentioned. That allowed the ratios of the labor share, depreciation share, and net interest share all to decline relative to value added, which fully (and virtually inevitably) describes the widening of margins during the fourth quarter.
But here is an interesting factoid. The nonfinancial corporate sector’s reported net interest bill actually rose (!) for the first time in 18 quarters. The uptick was tiny and swamped by the surge of nominal value added, but I assume we are supposed to extrapolate that inflection. So, as nominal value-added growth eventually moderates, as it must, the net interest share of value added should finally begin to rise. And this should contribute to a renewed narrowing of margins, although again at a pace that is unlikely to dominate the other drivers of equity market performance. As for profit margin mean reversion, that is a career destroyer, although margins would fall steeply in the event of recession. So, we need to continue monitoring that risk.
All three major components of the corporate direct cost base ticked down relative to value added
Source: BEA, Federal Reserve Bank of St. Louis (FRED), FH calculations
Data are actual to Q4.
[1] Incidentally, stabilizing net interest has contributed to the quickening of nominal GDI growth relative to its past few quarters during which the net interest bill was in outright collapse. Net interest costs paid by businesses are part of GDI, even though they detract from profits. In fact, the corporate sector’s contribution to GDI is initially measured as, their reported profits plus net interest payments.
—
Information provided by Front Harbor LLC has been obtained from sources believed to be reliable, but is not necessarily complete and its accuracy is not guaranteed. No claim is made regarding the fairness, accuracy, completeness, or correctness of the information and opinions contained herein. Views and other information provided here are subject to change without notice. All reports produced by Front Harbor are issued without regard to the specific investment objectives, financial situation or particular needs of any specific recipient and are not to be construed as a solicitation or an offer to buy or sell any securities or related financial instruments. Predictions, forecasts, and estimates for any and all markets should not be construed as recommendations to buy, sell, or hold any security or fund. The analyst authoring reports from Front Harbor may have positions in some of the securities discussed here.

