Bottom Line: To reinforce a high conviction point on the main debate for how many Fed cuts (if any) there will be in 2024, the inflation seasonal question is REALLY important. Powell noted that seasonal factors likely played a role in the hot January and February core CPI/PPI data at the FOMC press conference. The seasonal influences impacting CPI data should reverse some in March (hence the importance of March CPI reported on April 10th). Our call remains long Small caps, Cyclicals (particularly deep Cyclicals), GARP, and underweight the Low Vol factor.
Relevant News: Existing Home Sales (ESH) were much better than expected yesterday and have inflected higher over the past few months. This is happening despite the widely held view that people will sit on 3.5%ish mtg rates forever and that super low affordability will keep home sales pinned at unusually low levels. If you are using the post-GFC housing affordability as the base case, keep in mind that extremely high affordability was necessary to offset the household deleveraging cycle, affordability is not far from where it was pre-GFC.
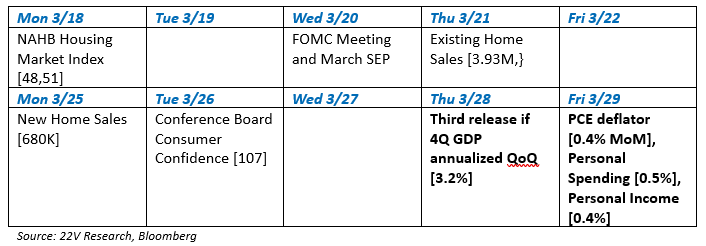
Things to Watch [Consensus, Results]:
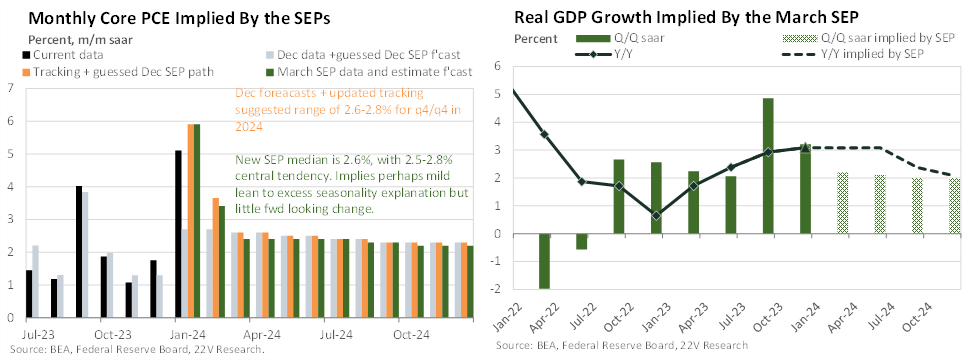
Economics: Further Details on Rate Path and Growth Outlook
The Fed’s dot for 2024 indicates a preference for rate cuts soon but acknowledges higher inflation and growth data, shifting rate cut expectations upwards (1-3 cuts vs 2-4 cuts in December ’23). With a 2.6% core PCE forecast for 2024, the Fed remains cautious, not overly extrapolating recent data. June appears likely for rate cuts, but not guaranteed, depending on inflation data (March CPI on 4/10 is particularly important first signpost). Beyond 2024 rates pricing ability of the rate cycle to continue beyond an initial 50-100bps of cuts is a real question given the medium-term forces facing inflation and the durability of growth since the hiking cycle began.
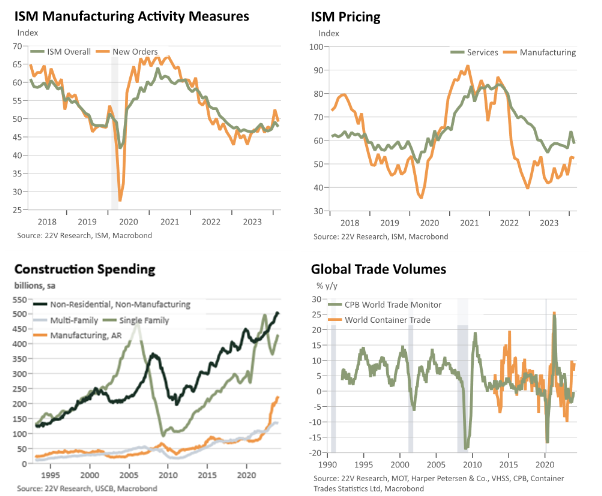
Adding to the better growth outlook, the evidence suggests that the manufacturing and durable goods economy is starting to slowly turn up after a sluggish past 18-24m. The ISM manufacturing PMI has been in an extended trough but appears to be tentatively making its way up towards 50; the new orders component shows a bit clearer degree of cyclicality. The S&P Global PMI, which 22V’s economist weights highly given its broader sample and historically better correlation with activity measures, has followed a similar path and is now slightly above 50, to its highest level since May 2022. At least partly thanks to the CHIPS Act, construction spending on manufacturing structures in the US is booming as well.
Portfolio Strategy: Divergence in Low Volatility Stocks across Market Cap
The Low Vol within mega caps has consistently lagged behind all other indices. Investors are willing to take on more risk within mega caps. For other indices, Low Volatility outperformed high Volatility names broadly YTD. That has been especially true for smaller caps, where financial condition influence, specifically credit risk, is higher. Stable financial conditions, which are likely to be in place for a while, would encourage a rotation out of Low Vol, particularly in the SMID space.

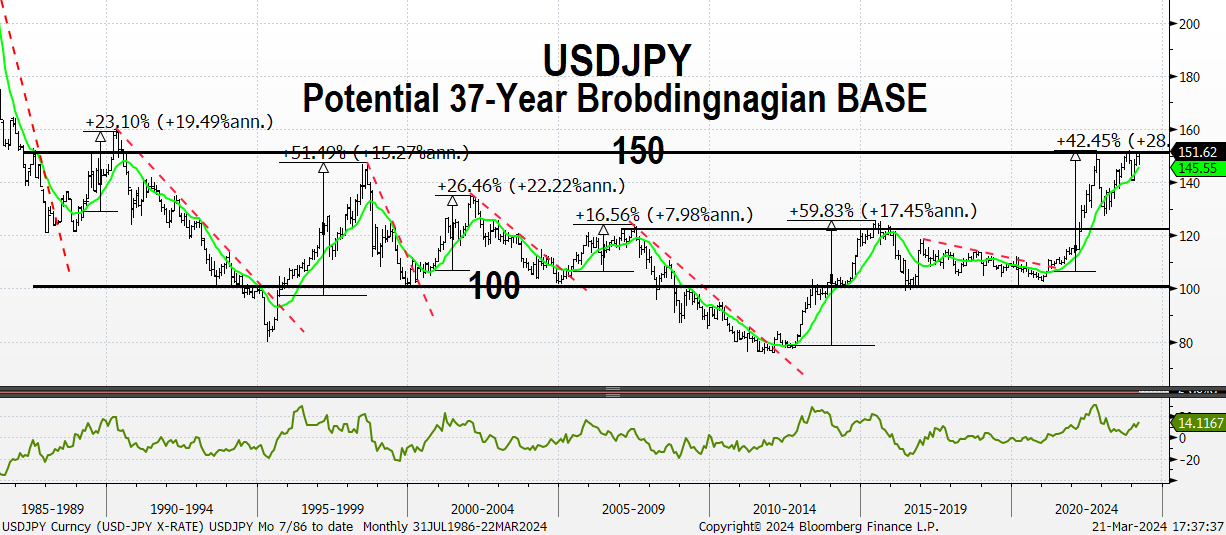
Technical Analysis: Chart Spotlight: USDJPY
The chart shows a USDJPY Potential 37-Year Brobdingnagian BASE where the cross is above its upward-sloping 12-Month MA and its Rate of Change indicator in the bottom panel is marching higher. According to 22V’s technician’s work USDJPY is a buy after a breakout from the Potential 37-Year Brobdingnagian BASE. Using the height of the BASE of 50 points measured from 100 at the bottom of the range – 150 at the top of the range added onto 150, a target of 200.