Chart Watchers – Before getting into today’s note, please check your Outlook inboxes for an invitation to my Webinar on Tuesday, March 19, 2024, at 10:30am. It’ll be a chart-apalooza good time with loads of charts, cheeky commentary, some cultural touchstones and, as has become a tradition, the 22V Technical Webinar Book Giveaway. Here’s the link to the Webinar: Webinar Registration – Zoom. See you on Tuesday.
In Blasphemous Rumors on March 12, 2024, I presented the idea that we were are at the juncture where Non-Growth would start to gain ground / outperform vs. Growth. Here were are my thoughts:
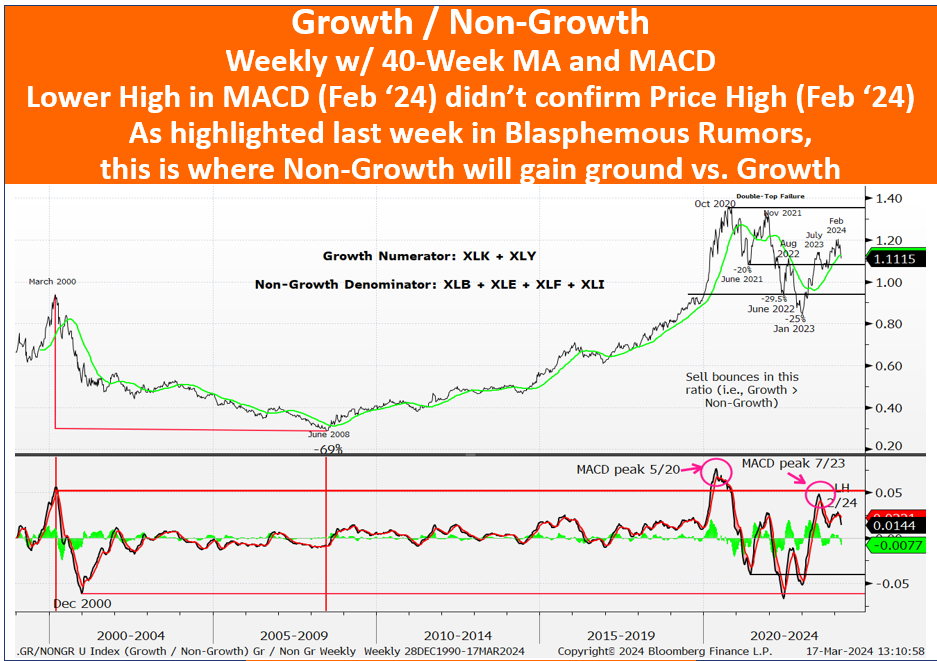
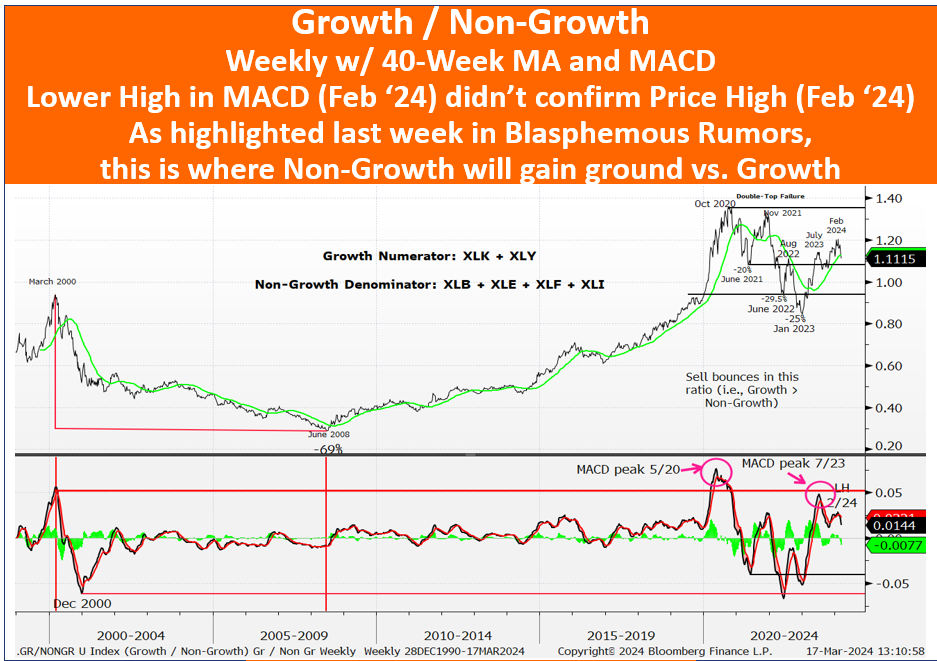 The weekly chart above shows my Growth / Non-Growth Ratio which is two ETFs in the numerator (XLK + XLY) divided by four ETFs in the denominator (XLB + XLE + XLF + XLI) with a corresponding MACD momentum indicator.
1 The Jan ‘23 – Feb ’24 outperformance rally for Growth over Non-Growth was +42% over 57 weeks which is not that different, when adjusted for length of advance, with what happened when the ratio gained 23% over 27 weeks from May ’21 – November ’21.
2 In this part of the cycle MACD momentum peaked in July ’23 well ahead of the now obvious lower high in MACD momentum which occurred in February ’24 (see LH for Lower High in the bottom panel). What’s occurring now is not an identical replay to what was seen in 2020, but MACD momentum peaked five months before price did (May ’20 vs. Oct ’20) and this time MACD momentum peaked seven months ago (July ’23 vs. Feb ’24).
3 In the 20 now 21 weeks since the S&P’s low / market’s turn from October 27, 2023, while the Growth component of my ratio added 28% 23 and beat the Non-Growth component’s 20%, both Growth has won 10X and Non-Growth has now won 11X. have each won in the weekly competition 10X. So, while Growth gets all the attention (rightfully so given 800bp of outperformance over 20 weeks), Growth is now only beating Non-Growth by 300bps. Further, Non-Growth deserves more respect than it gets / has gotten given that it is tied Growth for the now leading Growth in the number of weekly wins. To make matters more interesting, Non-Growth has beaten Growth in 9 of 15 10 of 16 weeks from Dec 1, 2023 – Mar 15, 2024, and the relative ratio between the two has moved lower by 4 ½% in favor of Non-Growth. is flat over this time frame. This is the reason a lower high has developed in the MACD telling us of the change in momentum from Growth to Non-Growth.
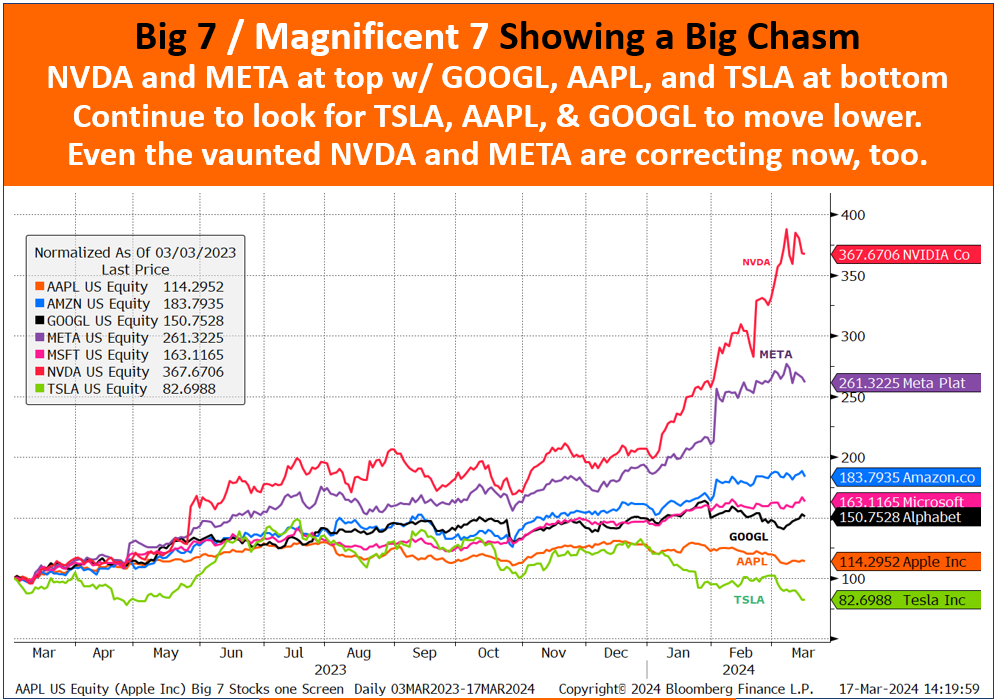
4 The loss in momentum for Growth might simply be explained via the Big Chasm among the Big 7 / Magnificent 7. The following chart appears in my weekly chart packets / Webinar chart packets / presentation chart packets and makes clear that price action for these Big 7 stocks is no longer monolithic.
To emphasize the change occurring for Non-Growth to outperform Growth consider that Non-Growth has beaten Growth in four of the last five weeks and since the Feb 9, 2024, peak in the Growth to Non-Growth Ratio (chart at top), the ratio is down by 7 ½% in favor of Non-Growth.
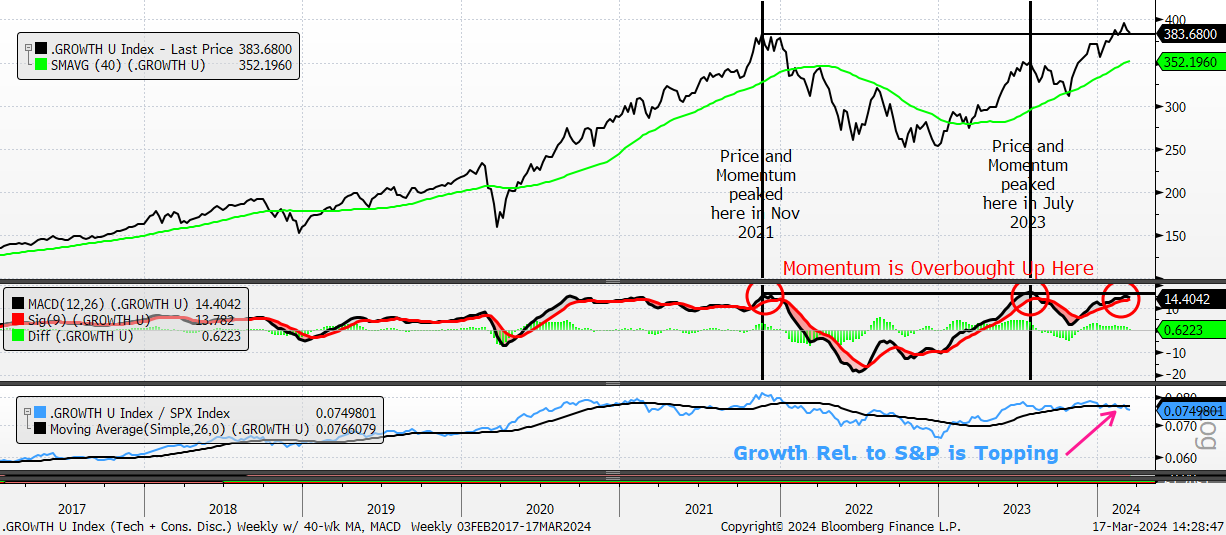
Growth Index – Weekly – Tech (XLK) + Consumer Disc (XLY) w/ 40-Week MA, Weekly MACD and Growth Relative to S&P 500. While the chart in the top panel is still healthy holding at / just above its breakout level, the momentum indicator in the middle panel is (a) overbought and is (b) overbought in an area where Growth peaked in late 2021 (-38% over 58 weeks) and corrected in 2023 (-11% over 13 weeks). And, perhaps more importantly, the bottom panel shows Growth Relative to the S&P 500 is topping with this relative ratio at its lowest level in 21 weeks (!) and is no different than it was in July 2020!
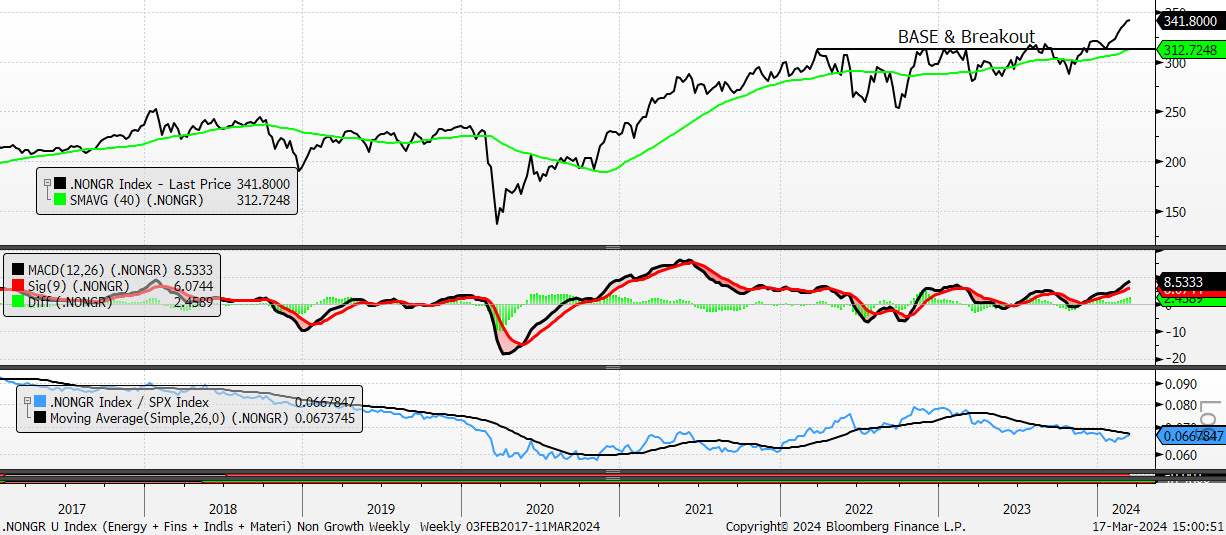
Non-Growth Index – Weekly – Energy (XLE) + Financials (XLF) + Industrials (XLI) + Materials (XLB) w/ 40-Week MA, Weekly MACD and Growth Relative to S&P 500. The chart in the top panel is in an encouraging position – notice the BASE & Breakout – and has gained for 8 weeks in a row adding 10% in the process. The MACD momentum indicator in the middle panel is still pushing higher. Non-Growth Relative to the S&P, in the bottom panel, is up 4% since the week ending Feb 9, 2024.
This chart is the same chart that appears at the top of this note, and this is a good time to emphasize the following: The Growth / Non-Growth Ratio has a Technical Score = 2, Neutral, down from a Technical Score = 3, Good, from one week ago. Recent performance figures for this Ratio look like this on a 1-day (-1.35%), 5-day (-2.39%), 1 month (-4.34%) and a 3-month (-4.15%) basis. And, on a 6 Month basis the Ratio is only up 2.3%. In short, Growth has lost momentum versus Non-Growth and, as the MACD in the lower panel shows, is not oversold. I’m going to keep looking for Non-Growth to outperform Growth until the MACD in the lower panel gets oversold, bottoms, and turns upward.