

A client sent me a very interesting and possibly important paper by Wendy Edelberg and Tara Watson published by The Hamilton Project at Brookings. The paper argues that the BLS’s failure to incorporate the effects of recently surging immigration on the labor force has resulted in a steep underestimation of the speed limit on employment growth. As I calculate the implications of their figures, the “speed limit” on establishment payroll growth might be 2.2% per year or almost 300k per month, which would be three times as fast as what is implied by the BLS’s own labor force assumptions if taken at face value.
The implication for potential GDP growth would be slightly less dramatic, largely because the CBO’s own work on potential already assumes significantly higher population growth than the BLS incorporates, for reasons that are discussed in the paper. Using the authors’ population assumptions, which are somewhat more aggressive than CBO’s, would imply potential GDP growth of around 3% vs the 2.1% figure used by the CBO itself, and the 1.8% figure assumed by the Fed. I might add in passing that the Fed is also implicitly assuming that the BLS figures are too low, although they do not present a specific potential growth accounting in their quarterly updates, one of which is due next week.
An obvious question is whether or not this claim is dovish, if true. My own judgment is that this point has to be at least somewhat dovish. However, there is a complexity here that I would like to address immediately. The Fed leadership often invokes the idea that real interest rates – or perhaps more precisely broader financial conditions correctly defined – operate on the output gap rather than on the rate of real growth itself. So, if potential growth were to be higher than expected, then that might have no implication for the appropriate policy setting. To be sure, the higher potential growth rate would resolve a puzzle between developments in aggregate demand and the behavior of the labor market. And that is in fact the main point of the paper, whose title is New immigration estimates help make sense of the pace of employment. However, contrary to our intuition this would have no implication for the appropriate monetary policy setting. And conversely, a slowdown of GDP growth would similarly have no implication, iff it were driven by a corresponding change of potential growth. Or so goes the simple theory, as recently often expressed (surprisingly to me) by Fed officials.
My own view is that that take is probably too reductive, but we need not get into it here. Rather, the simpler point is probably the most practically important. If potential GDP growth is faster and the speed limit on employment growth is higher, then recent strength GDP and employment is less alarming. If faster growth maps to a higher r* (or tighter equilibrium financial conditions), then that might provide some offset in terms of the implications for policy. Policy would have to be less restrictive relative to normal, because there is less of a growth overshoot to tame, but normal would be “higher.” It’s complicated, especially when we benchmark to what people in markets believe, rather than what the official data imply. But in this note I want to just quantify what the implications for potential and the employment speed limit would be if Edelberg and Watson turn out to be right about the population growth and the related resolution of what has been a labor market puzzle.
Before turning to that, though, I want to cover very briefly how this might relate to the recent weakness of the household survey measure of outright employment growth, both outright and relative to what is implied by the establishment survey of employment growth. In principle, faster population growth than recognized might mean that the household survey is understating employment growth, which would help resolve a puzzle I highlighted in a note on the weekend.. But the bottom line is that it would not help much! The reason is that the weakness in the household survey during the past few months quantitatively overwhelms the technical issues raised in the paper. This is so obvious that I will skip documenting it. If you believe that the household survey is giving a warning here, you don’t need to reassess based on the subject of this note. I mention this because that was the first idea that popped into my head when I read the paper, wrongly as it turns out, and very obviously.
The BLS may be very low on population growth last year

Green is the authors. Black is what is in the household survey
Much of the paper is dedicated to a technical discussion of why the population assumptions implicit in the household survey measure of employment growth and in our sense of the speed limint on employment growth as measured in the establishment survey are too low. I will not get into that here, because I am not competent to assess the argument, and am better positioned to set out the macro implications of their claim possibly being correct. But the chart immediately above presents their bottom line. While the BLS assumes that population growth ran at just over 1.5 mm during 2023, the authors’ speculate that the correct figure might be 1.5 mm. Measured in percentage growth rate terms, these would map to 2.54% vs 0.99%. Those percentage figures are offered with false precision, but I do not want to use rounded figures because the imprecision introduced by doing so would compound as I go through the implications.
Assuming a secular decline in the natural labor force participation rate of about 0.3% a year, the difference in potential labor force growth (as of 2023) would be 2.24 vs 0.69%. And mapping that to the establishment survey would mean that the pace of employment growth there consistent with a stable unemployment rate would be 290k a month, vs the 90k implied by the BLS population assumption. During the 12 months to February, monthly employment growth has been 230k. For reasons I do not need to get into here, for fear of inducing an even larger headache, this approach would suggest that we should have expected a slight easing of my measure of the Employment Gap over the past twelve months, even assuming that the establishment survey measure of employment growth is precisely correct. In fact, the employment gap has gone sideways. And this would all make sense if the consensus view that the establishment survey slightly overstates growth is in fact correct. So Edelberg and Watson clearly resolves a puzzle, iff their population assumptions are correct
This chart would certainly fit
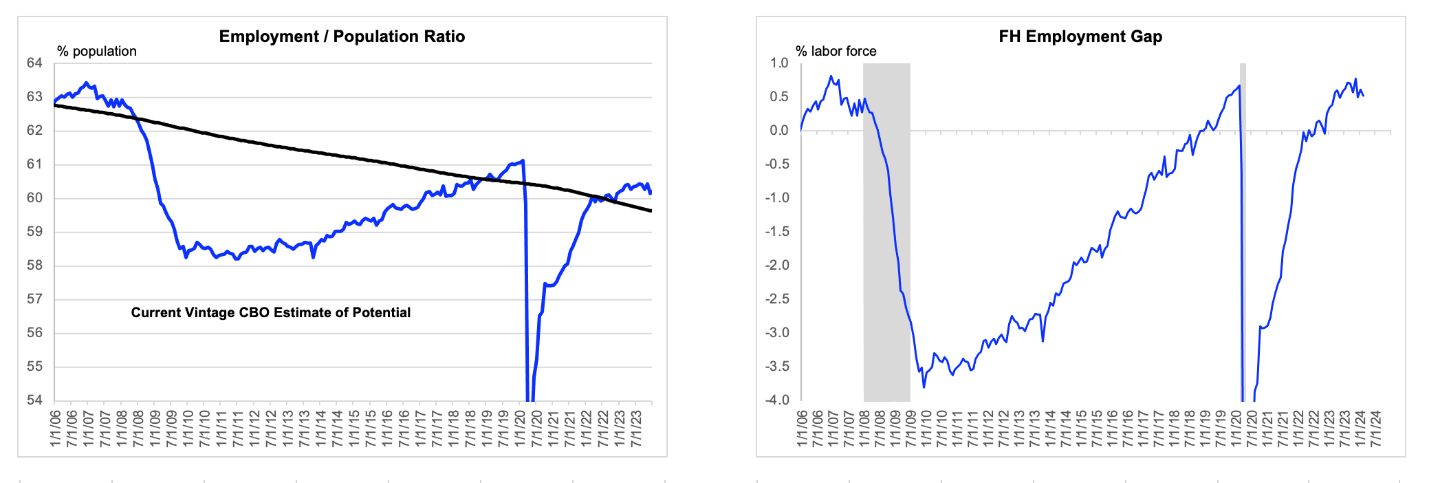
Data are actual to February.
Let me conclude by elaborating a bit on an issue to which I alluded in passing above. For market participants a big part of the debate here is whether this sort of analysis is dovish (I think it is) and by how much. Part of the answer to that rests on the theoretical question of whether policy operates on the growth rate or the change of the output gap. I don’t have much to offer on that, as mentioned. But a bigger consideration here might relate to what the typical market participant already believes to be the case. And when you factor that in, the dovish implications of this analysis almost certainly get scaled down. The reason is that investors do not really believe that the current and recent trend of employment growth is as far above the speed limit as the BLS assumptions on population growth would themselves imply. The typical participant might not have a particularly built out reason for having that view, but they almost certainly do have it.
The question of how to assess the implications for policy of potential GDP growth being higher because of higher population growth is a bit different. The CBO’s estimate of potential GDP growth is 2.1% for 2023. And that estimate is based on their own assumption that population growth was 1.7%, 70 bps higher than the BLS assumes. This is 80 basis points, not 150 basis points below, what the authors imply might be appropriate.
So, if the CBO accepted the authors’ assumption on population growth, they might have a potential GDP estimate of 2.7%. During the 4-quarters to Q4 2023, the GDP is reported as up 3.1%. The current best guess of how GDO will print when those data are released at the end of the month is currently 2.5%. Without getting into measurement issues that might make GDO a slightly less attractive alternative to GDP in the current setting than is typically the case, we can say – again – that this would resolve a puzzle. But the resolution applies more to gaps in the official data than to investors’ perceptions. Still,those perceptions might be more firmly held if this paper were taken as valid. And at the margin, that is probably marginally dovish. But the main point of this note has been just to do the numbers. I hope it helps.
[1] Please note, all the figures cited in this note take as given the authors’ estimates of population growth. In the interest of consistency and of not having too many numbers in the air, I draw a set of implications for macro that are based exclusively on my own calculations from there. In contrast, the paper cites figures that will be slightly different from mine. But my approach places the figures in context that will be familiar to readers and may strike you as more relevant to your own concerns. I enjoy papers like this, where they do the heavy lifting and leave speculations on the actual practical implications to others.
[2] This argument will be easier to follow if you incorporate the following point. The BLS household survey directly surveys for rates only: the employment rate, the labor force participation rate, and the unemployment rate, etc. To convert these to aggregate levels requires estimates of the population itself. So, for example, if population growth is understated, then so too will be the household survey measure of employment growth relative to any surveyed employment rate or employment/population ratio, as it is more commonly called. Analogously for the labor force, etc. But the establishment survey measure of employment growth is not affected by this issue.

