Back Technical Analysis

Off the Wall

Published on March 10, 2024

∙ Download the PDF Report

By

John Roque

When asked to name Michael Jackson’s best album, most choose the undeniably fantastic Thriller (1982) which had seven hit songs and has sold more than 70 million albums worldwide! I tend to lean, however, to his prior release which was called Off the Wall (1979). Only 20 million albums have been sold worldwide and, by my count, it has eight hit songs. Too, and this is pure luck on my part, Quincy Jones, who produced both records, has called Off the Wall Jackson’s magnum opus.

I thought about Off the Wall while looking agog at the chart and performance over all manner of time frames for NVIDIA. I know you know the following, but for posterity’s sake here are some numbers worth reviewing: NVDA’s market-cap makes it 5% of the S&P, 8% of NASDAQ and 38% of the SOX. At its intra-day high on Friday, it was 96% above its 200-Day MA, as of Friday’s intra-day high it was up 323% on a year/ year basis, and it’s up almost 300% on a 2-year basis, 602% on a 3-year basis, and 1602% on a 4-year basis. To say NVDIA’s been “Workin’ Day and Night” is an under-statement and to say it is overbought is a more egregious understatement such that nobody should be shocked if NVDA’s intra-day reversal on Friday is the first salvo in a corrective phase. To tie this all together this is likely a good time to be reminded of Bob Farrell’s classic admonition that, “Exponentially rapidly rising or falling markets /stocks usually go further than you think, but they do not correct by going sideways.” At least that’s the way things used to work.
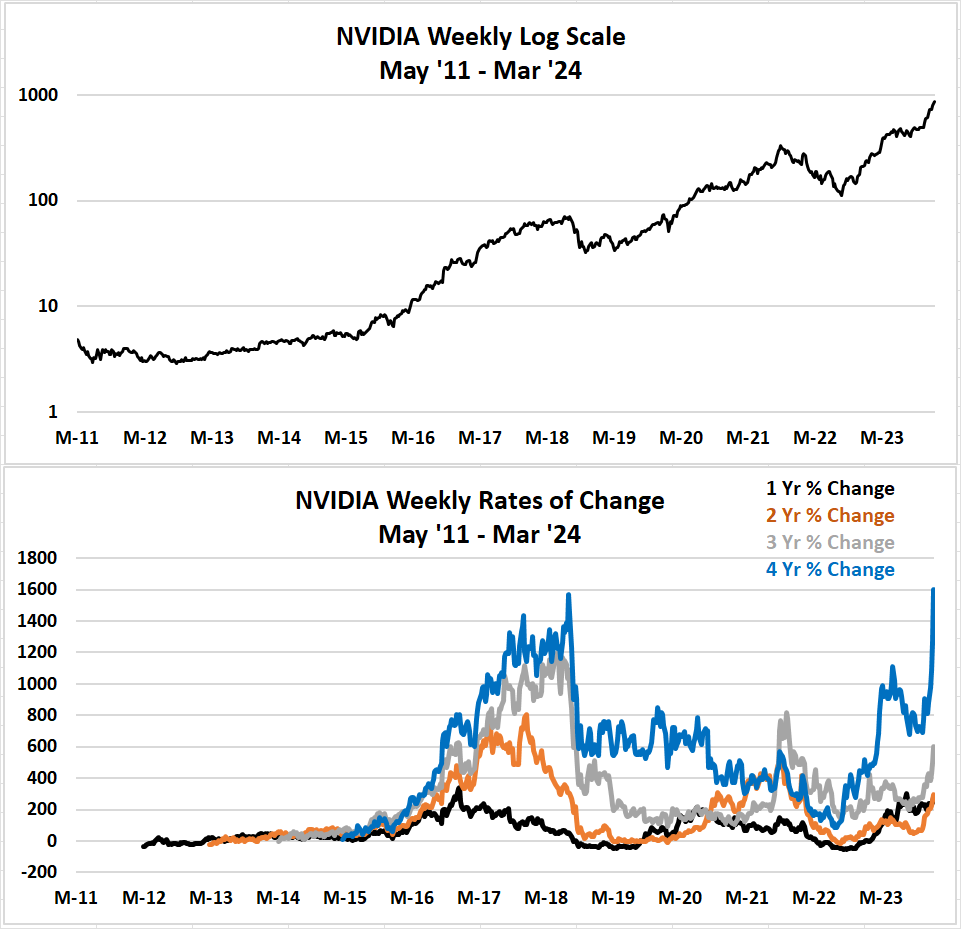
A graph of a log scale and a chart of a graph of a log scale

Description automatically generated with medium confidence
Source: 22V Research

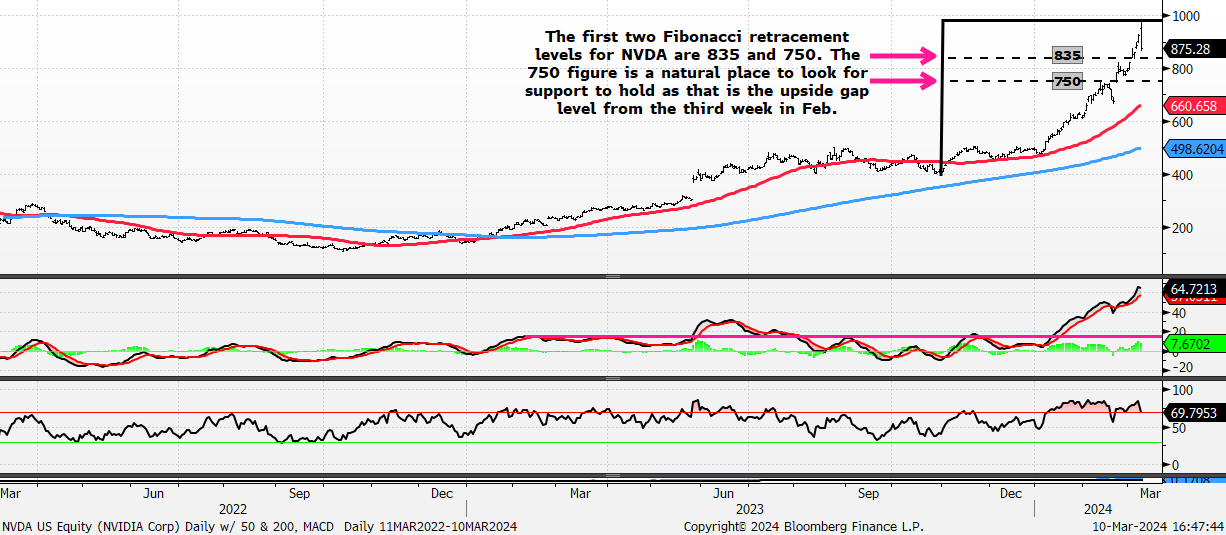
NVIDIA – Daily w/ 50- and 200-Day Moving Average with MACD and RSI. Measuring NVDA’s advance from its Oct 31, 2023, low – Friday’s intra-day high and extrapolating potential support levels on a pullback offers Fibonacci retracements (24% and 38%) of 835 and 750.
A graph of a stock market

Description automatically generated with medium confidence
A graph of stock market data

Description automatically generated with medium confidence

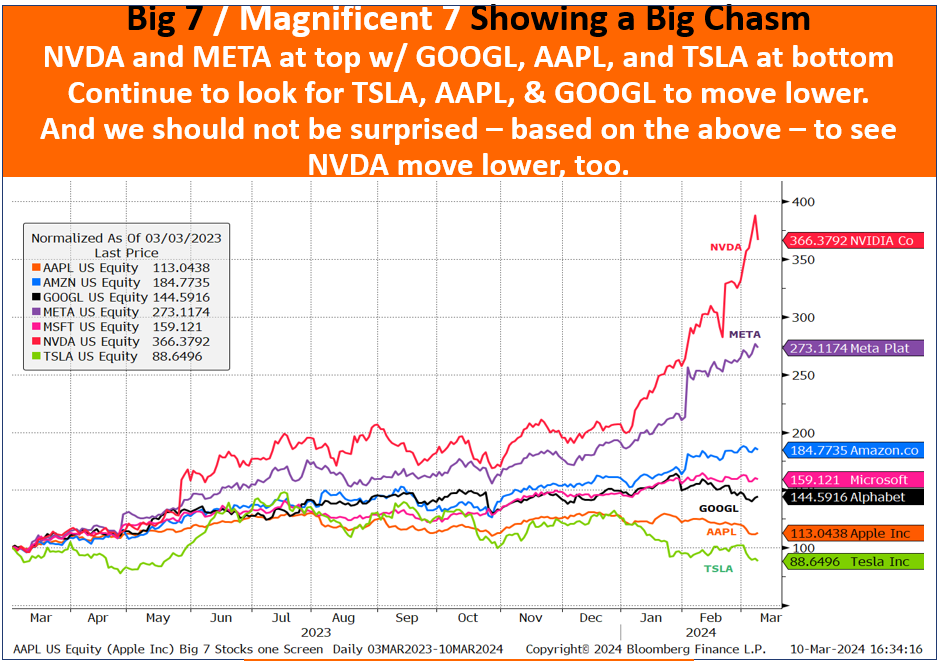
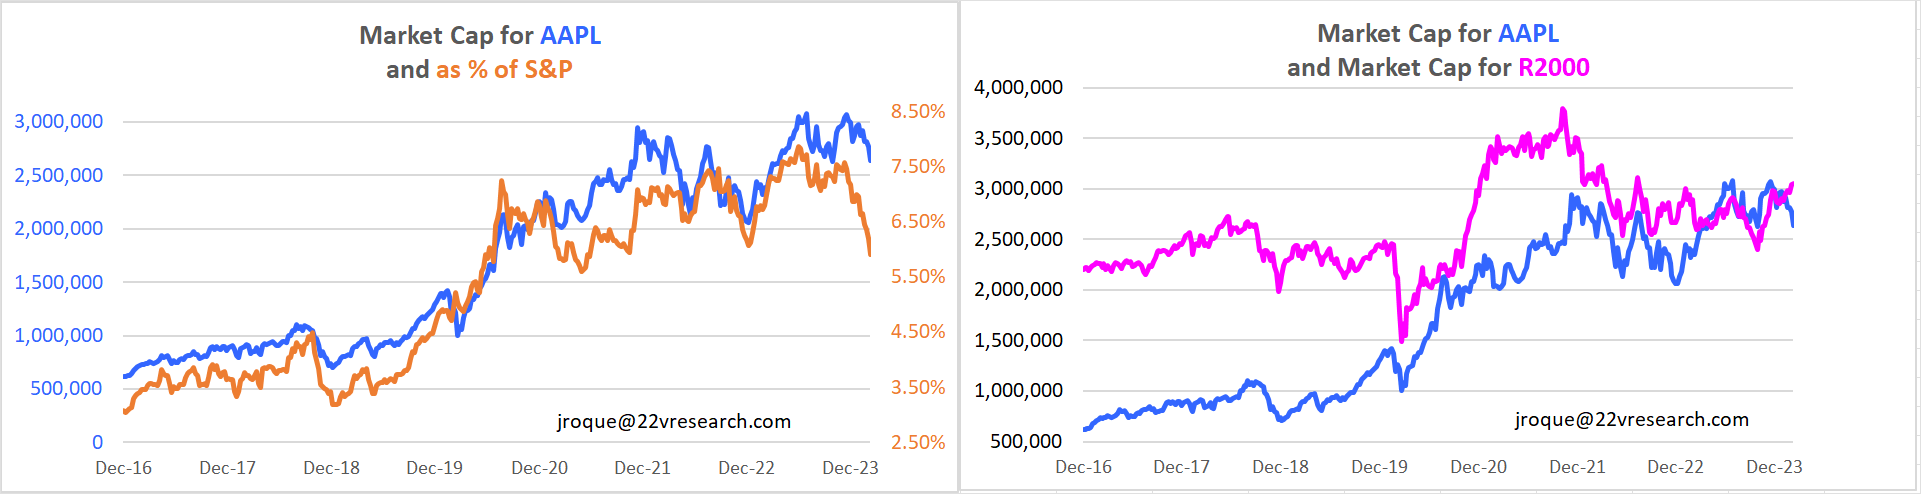
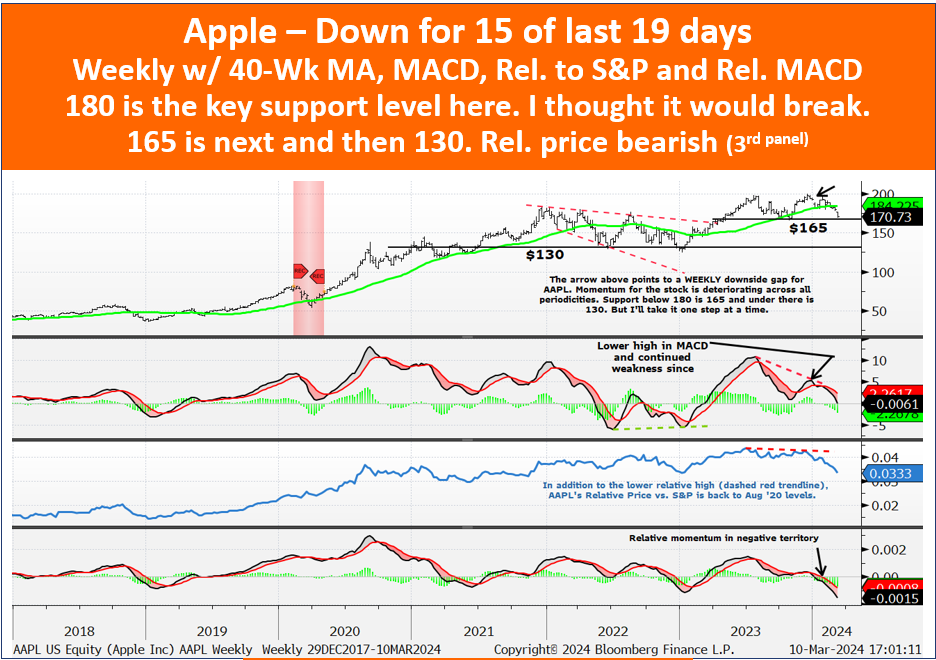
As noted above, I’m still looking for Apple (i.e., The Scarlet Letter, Jan 10, 2024, and The Scarlet Letter Part 2, Feb 26, 2024) to work lower.
A screenshot of a graph

Description automatically generated
Source: 22V Research
A graph of stock market

Description automatically generated with medium confidence

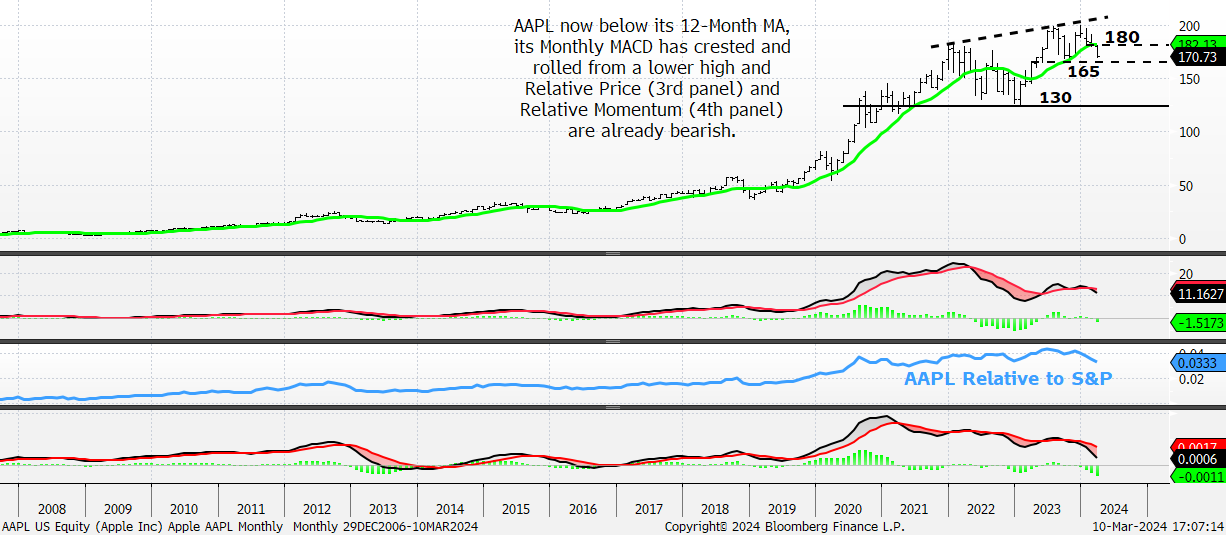
Apple – Monthly w/ 12-Month MA, MACD, Rel. to S&P and Relative Momentum – AAPL now below its 12-Month MA, its Monthly MACD has crested and rolled from a lower high and Relative Price (3rd panel) and Relative Momentum (4th panel) are already bearish.
A graph of a stock market

Description automatically generated with medium confidence

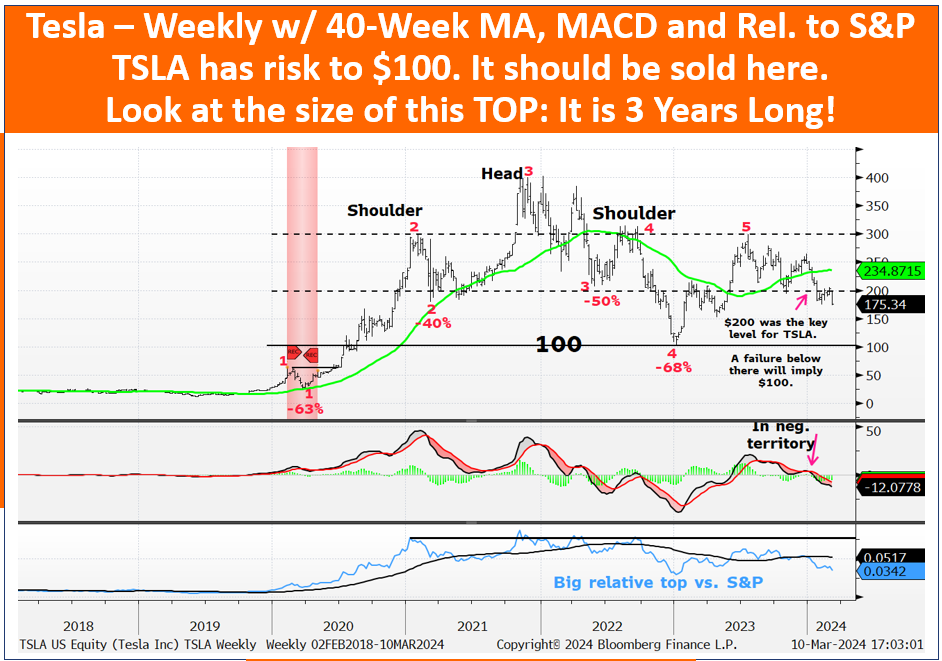
Tesla’s not in the S&P Info Tech / XLK, but it is a member of the Big 7 so I included it.
A graph of stock market

Description automatically generated

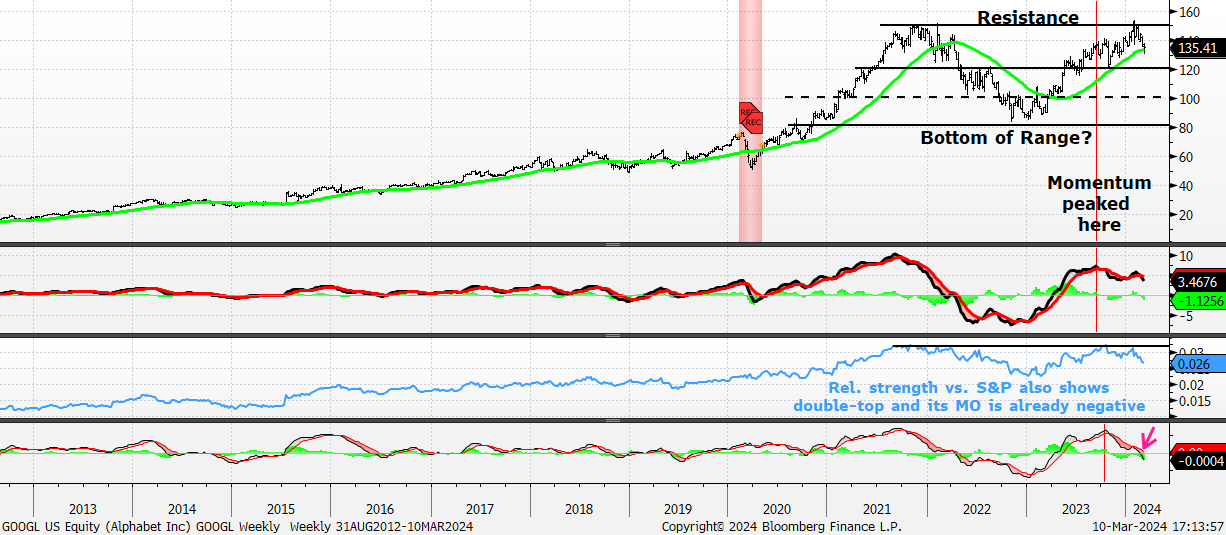
Alphabet – Weekly w/ 40-Week MA, MACD, Rel. to S&P and Relative Momentum – GOOGL looks to be where AAPL was a few short weeks ago as it hugs its upward-sloping 40-Week MA. I think it works lower owing to the same factors that applied to AAPL: deteriorating absolute momentum and bearish relative price action and bearish relative price momentum. 120 looks to be the first support level for GOOGL and then 100 thereafter. Is the bottom of the range @ 80?
A graph of a stock market

Description automatically generated with medium confidence

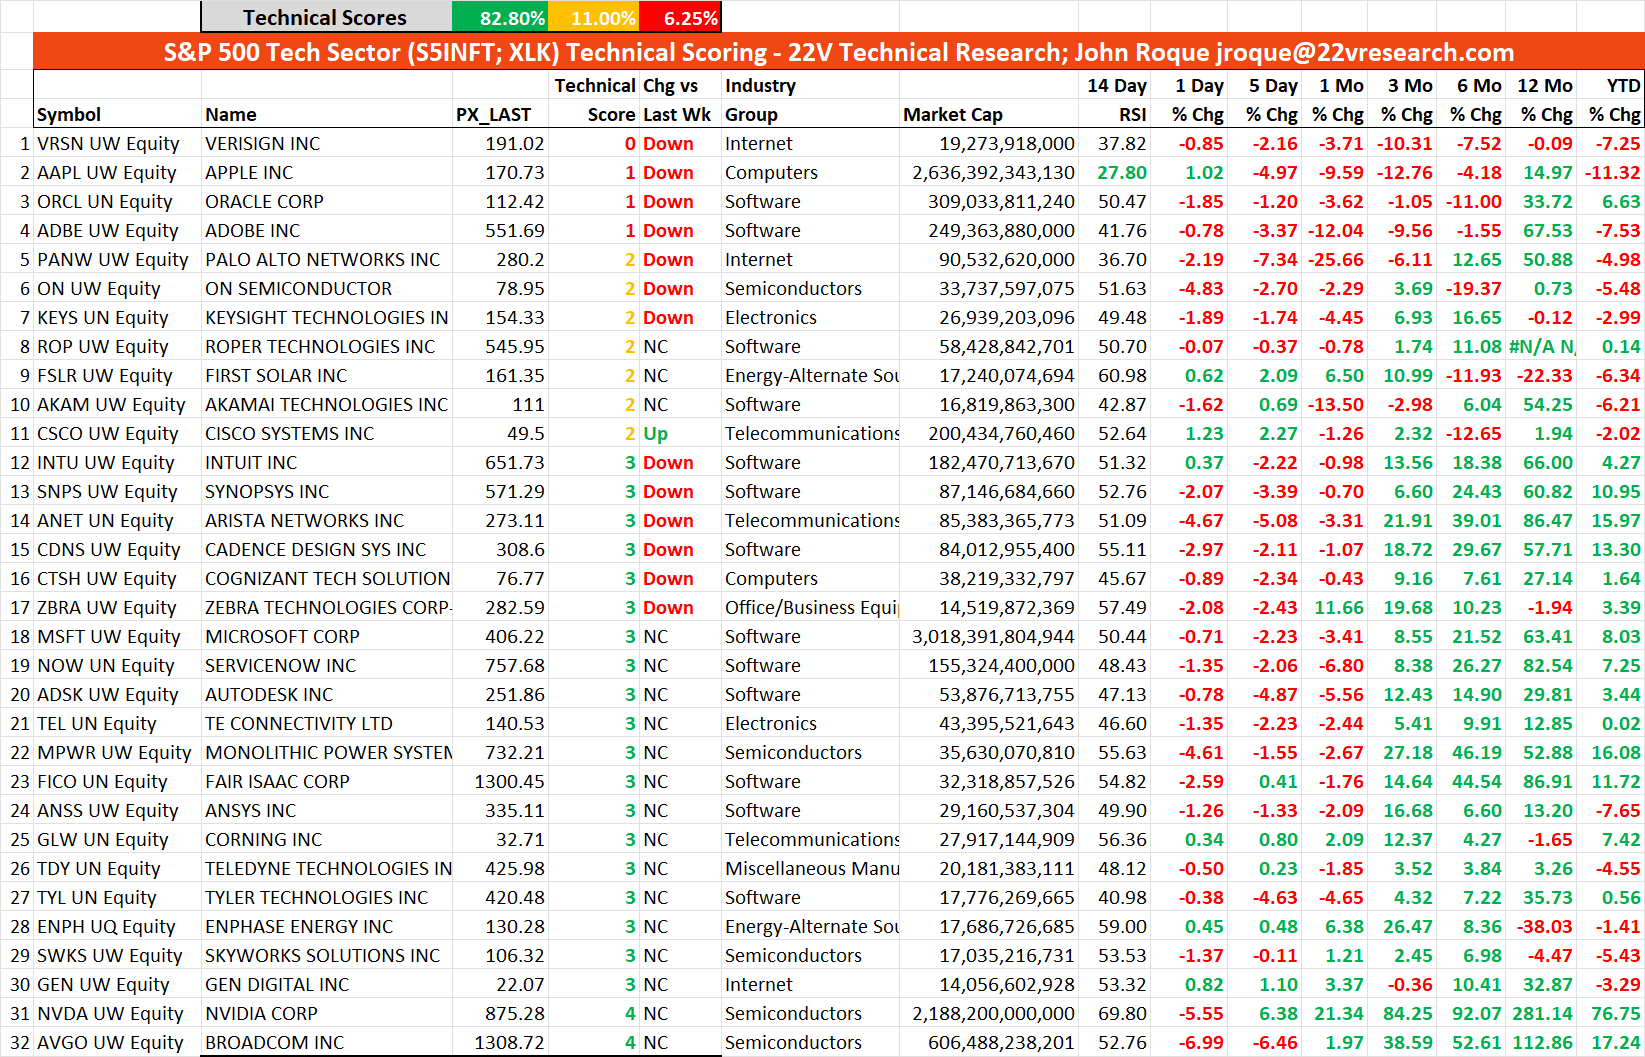
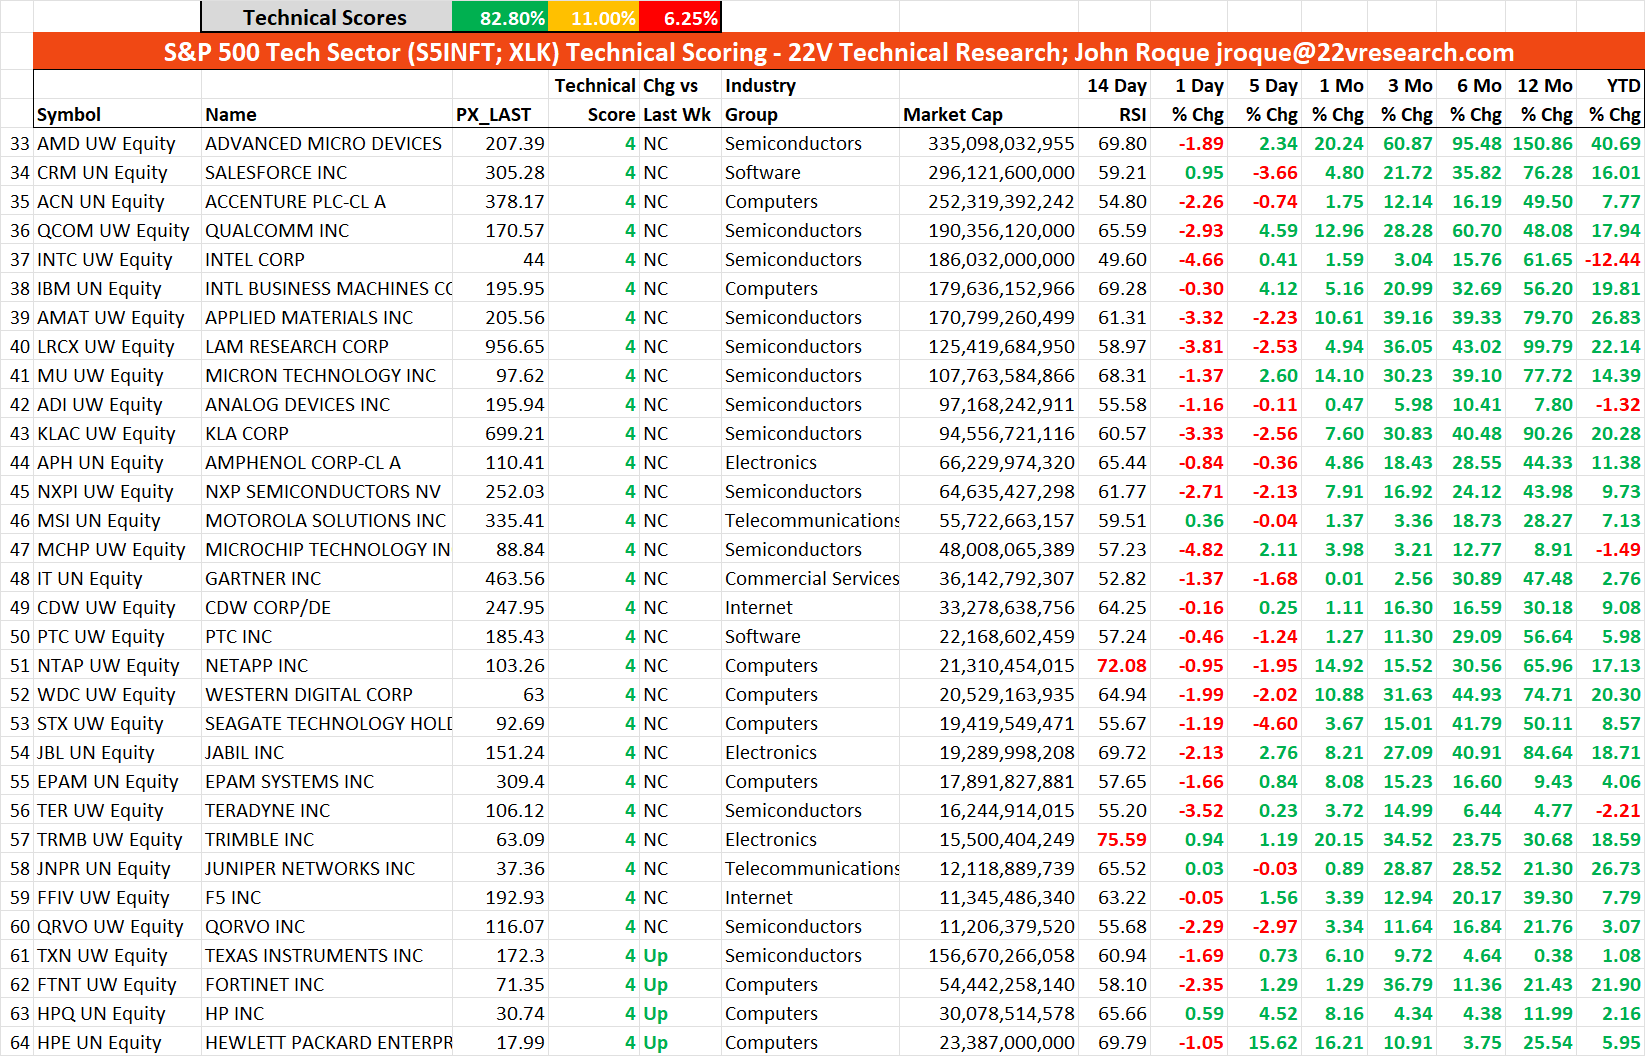
What follows is the overall Technical Scoring for the S&P Information Technology Sector (XLK). While the overall Scores are still stellar with 83% Good / Strong and only 6% Weak, the Scores are presented to focus on the Change vs. Last Week column because 20% of the stocks had Scores move lower in the last week. It’s safe to say the group is no longer monolithic.
A screenshot of a computer screen

Description automatically generated
Source: 22V Research
A screenshot of a computer screen

Description automatically generated
Source: 22V Research

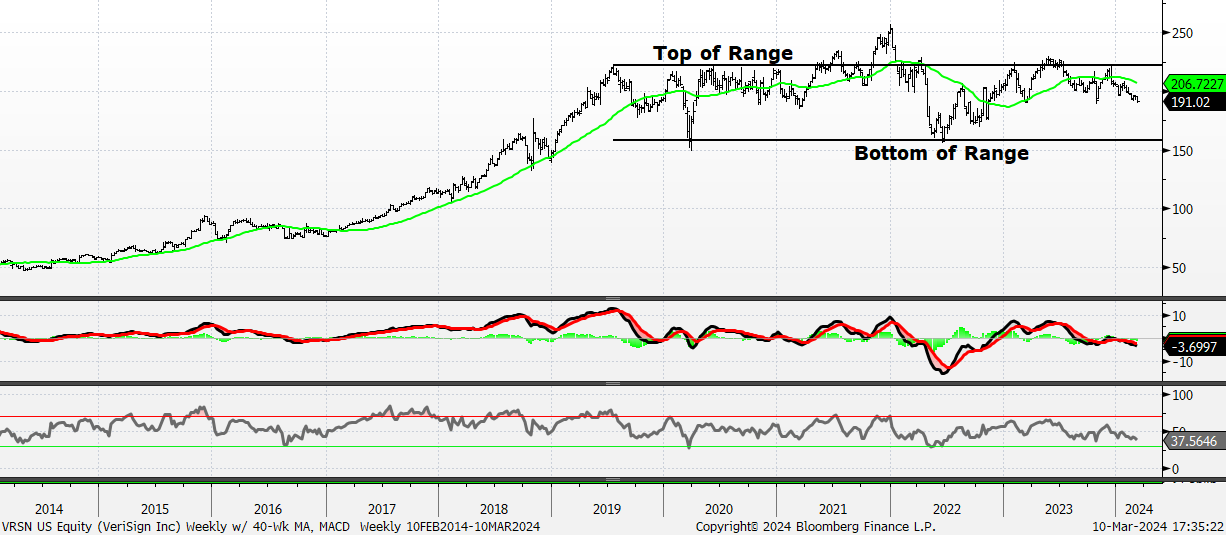
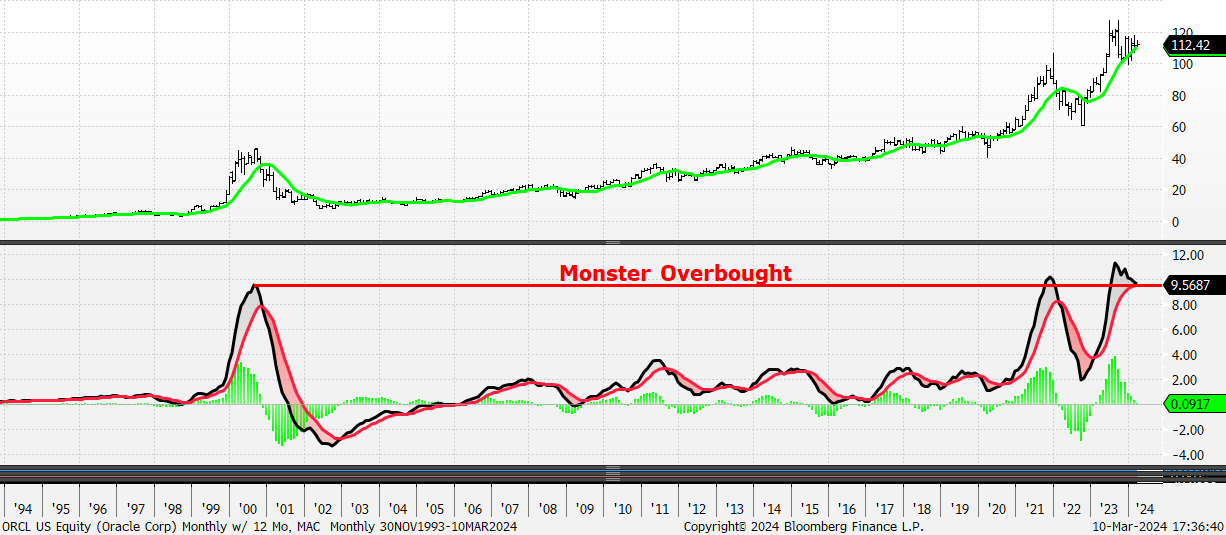
In addition to expecting lower levels for AAPL, GOOGL, and TSLA, VeriSign (VRSN) is and has been bearish and investors should be ready for Oracle (ORCL) and Adobe (ADBE) to move down, too. Also, it seems right to say that Palo Alto Networks (PANW) is on its way to retesting its upward-sloping 200-Day MA with key support @ 250. PANW closed @ 280 on Friday. ON Semi (ON) is a better sale on my work with risk to Oct low; it closed just under 79 Friday. Intuit (INTU) looks like it can follow Adobe and that’s not a compliment. And, lastly, Cognizant (CTSH) has big resistance @ 80.

VeriSign – Weekly w/ 40-Week MA, MACD and RSI – Technical Score = 0; Risk to 160 / Bottom of Range
A graph of stock market

Description automatically generated

Oracle – Monthly w/ 12-Month MA and MACD – Technical Score = 1; it’s not evident here because this is a monthly chart but check the daily version and you’ll see that ORCL has had two especially prominent downside gaps since Sept ’23. Coupled with its Weak Technical Score and cresting Monthly MACD (lower panel) says it’s probably a pretty good idea not to be too complacent here.
A graph of a stock market

Description automatically generated with medium confidence

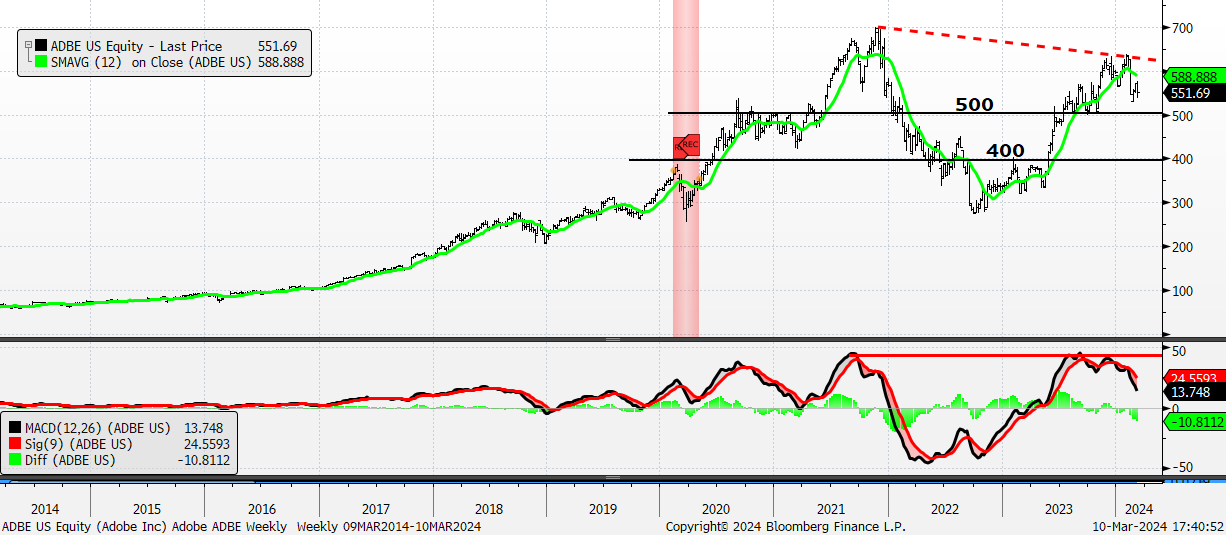
Adobe – Weekly w/ 40-Week MA and MACD – Technical Score = 1; ADBE is already beneath its downward-sloping 40-Week MA and Weekly Momentum via the MACD in the lower panel is going away at a rapid rate. 500 is key support but I don’t think it will hold. 400 sounds like hyperbole as a support level below 500, but that’s what the chart suggests.
A graph of stock market

Description automatically generated

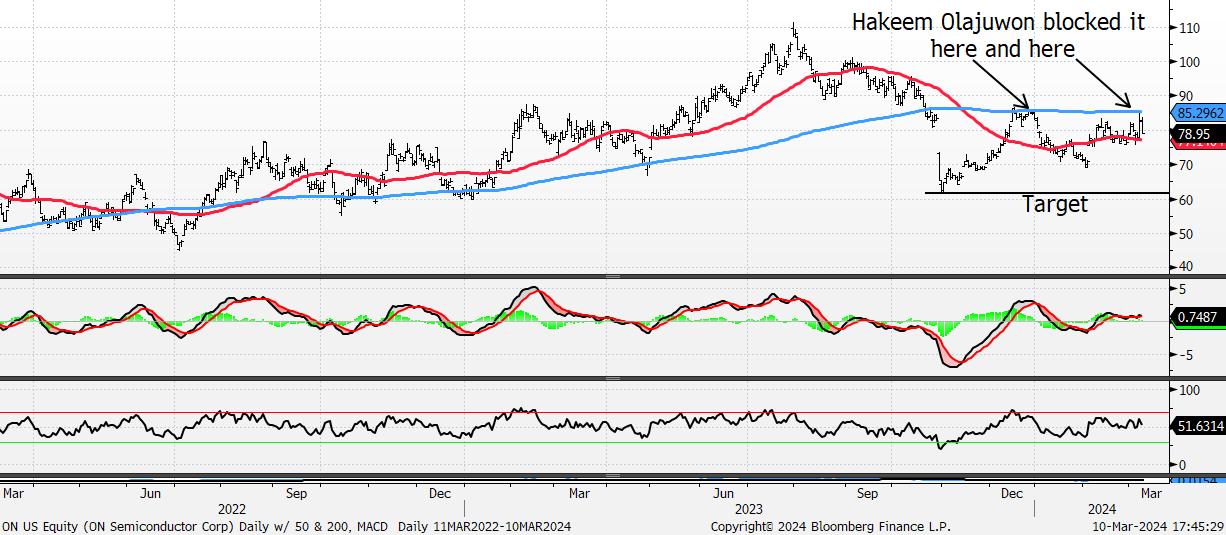
ON Semi – Daily w/ 50 and 200-Day MAs and MACD – Technical Score = 2; Hakeem Olajuwon was active in December 2023 and again in March 2024 as the stock was turned away twice from its cresting 200-Day Moving Average. Risk to low 60s / Oct ’23 low.
A graph of stock market

Description automatically generated

DISCLOSURES AND DISCLAIMERS

Analyst Certification

The analyst, 22V Research Group, primarily responsible for the preparation of this research report attests to the following: (1) that the views and opinions rendered in this research report reflect his or her personal views about the subject companies or issuers; and (2) that no part of the research analyst’s compensation was, is, or will be directly related to the specific recommendations or views in this research report.

Analyst Certifications and Independence of Research.

Each of the 22V Research analysts whose names appear on the front page of this report hereby certify that all the views expressed in this Report accurately reflect our personal views about any and all of the subject securities or issuers and that no part of our compensation was, is, or will be, directly or indirectly, related to the specific recommendations or views of in this Report.

22V Research (the “Company”) is an independent research provider. The Company is not a member of the FINRA or the SIPC and is not a registered broker dealer or investment adviser. 22V Research has no other regulated or unregulated business activities which conflict with its provision of independent research.

22V Research, LLC is a professional services and independent publication organization. 22V Research, LLC is not a securities broker-dealer, not a member of the Financial Industry Regulatory Authority (FINRA), not a registered investment advisor (RIA) and not a member of SIPC.

Securities transactions, when offered, are offered by 22V Securities, LLC through LPS Capital, LLC. Certain employees of 22V Securities, LLC are dually registered as securities representatives of LPS Capital, LLC or Analyst Hub Securities, LLC. 22V Securities, LPS Capital and Analyst Hub Securities are members FINRA, SIPC.

https://brokercheck.finra.org/

Current Ratings Definition.

SECTOR OUTPERFORM: An “outperform” rating anticipates the company will outperform the S&P Regional Banking Index (peer group).

SECTOR PERFORM: A “market perform” rating anticipates the company will perform in line with the S&P Regional Banking Index (peer group).

SECTOR UNDERPERFORM: An “underperform” rating anticipates the company will underperform the S&P Regional Banking Index (peer group).

Limitation Of Research And Information.

This Report has been prepared for distribution to only qualified institutional or professional clients of 22V Research Group. The contents of this Report represent the views, opinions, and analyses of its authors. The information contained herein does not constitute financial, legal, tax or any other advice. All third-party data presented herein were obtained from publicly available sources which are believed to be reliable; however, the Company makes no warranty, express or implied, concerning the accuracy or completeness of such information. In no event shall the Company be responsible or liable for the correctness of, or update to, any such material or for any damage or lost opportunities resulting from use of this data. Nothing contained in this Report or any distribution by the Company should be construed as any offer to sell, or any solicitation of an offer to buy, any security or investment. Any research or other material received should not be construed as individualized investment advice. Investment decisions should be made as part of an overall portfolio strategy and you should consult with a professional financial advisor, legal and tax advisor prior to making any investment decision. 22V Research Group shall not be liable for any direct or indirect, incidental or consequential loss or damage (including loss of profits, revenue or goodwill) arising from any investment decisions based on information or research obtained from 22V Research Group.

Reproduction And Distribution Strictly Prohibited.

No user of this Report may reproduce, modify, copy, distribute, sell, resell, transmit, transfer, license, assign or publish the Report itself or any information contained therein. Notwithstanding the foregoing, clients with access to working models are permitted to alter or modify the information contained therein, provided that it is solely for such client’s own use. This Report is not intended to be available or distributed for any purpose that would be deemed unlawful or otherwise prohibited by any local, state, national or international laws or regulations or would otherwise subject the Company to registration or regulation of any kind within such jurisdiction.

Copyrights, Trademarks, Intellectual Property.

22V Research Group, and any logos or marks included in this Report are proprietary materials. The use of such terms and logos and marks without the express written consent of 22V Research Group is strictly prohibited. The copyright in the pages or in the screens of the Report, and in the information and material therein, is proprietary material owned by 22V Research Group unless otherwise indicated. The unauthorized use of any material on this Report may violate numerous statutes, regulations and laws, including, but not limited to, copyright, trademark, trade secret or patent laws.
