Choose Your Own Adventure with the Employment Report
The headline beat on non-farm payrolls (+275k vs 200k consensus) was more than taken away by the negative revisions to last two months of -167k. As has been the case since the December data, the household survey looks notably weaker than the employer survey.
Taking all the inconsistencies and somewhat difficult to reconcile internals together, the February data is perhaps a bit dovish, attenuating some recent concerns of re-heating, and keeps my own view that May odds of a first cut are slightly higher, if still well below 50%, than current pricing of 27%.
The base case remains that the cuts which are coming are going to be of the mid-cycle correction variety, with the precise timing of cuts driven by the inflation data while the labor market and growth data determine their depth. The Fed is unlikely to end up cutting to neutral before the next recession hits as growth durability and residual inflation concerns give them little incentive to move towards outright neutral policy; this is relative to my roughly 3.5% nominal neutral (3-4% range) view and not the Fed’s too-slow-to-adapt current 2.5% long-run dot.
The rates’ price action (2Y down 4bps while the 10Y is up slightly) seems consistent with a cyclical extension read of the data as well.
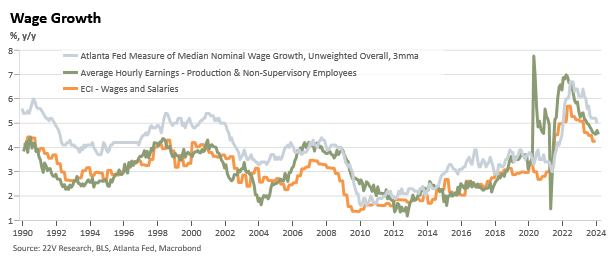
The Employer Survey and Prime-Age Data Paint a Fairly Optimistic Picture
While the headline NFP numbers were notably revised down over the past couple of months, the overall trend in that data remains quite healthy and consistent with a tight but not particularly inflationary labor market.
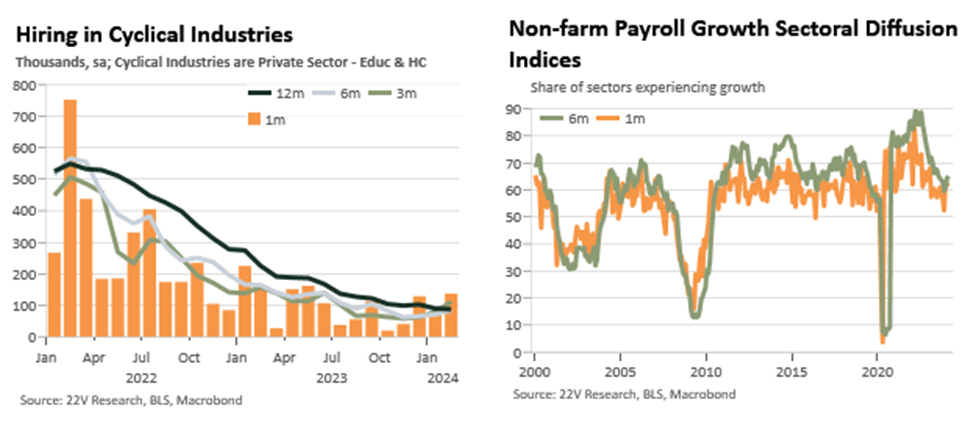
Hiring in cyclical industries (the private sector less education and healthcare) has been running around 100k on a 3-6m basis. Leisure and hospitality has been a key driver over this growth, although its trend pace has been decelerating in line with the broader data. Cyclical hiring ex L&H seems to be bouncing somewhat over the past 4 months, with the negative numbers seem in the summer and fall seemingly in the rearview mirror (3m avg gains have gone from 17k in Oct to 77k in Feb). Acyclical hiring (government, education, and healthcare) continues to see strong monthly gains. 3-6m pace of roughly 140k, and has been a key source of support for the overall labor market given structural tailwinds to healthcare and the catchup hiring needs of the less compensation competitive public sector.
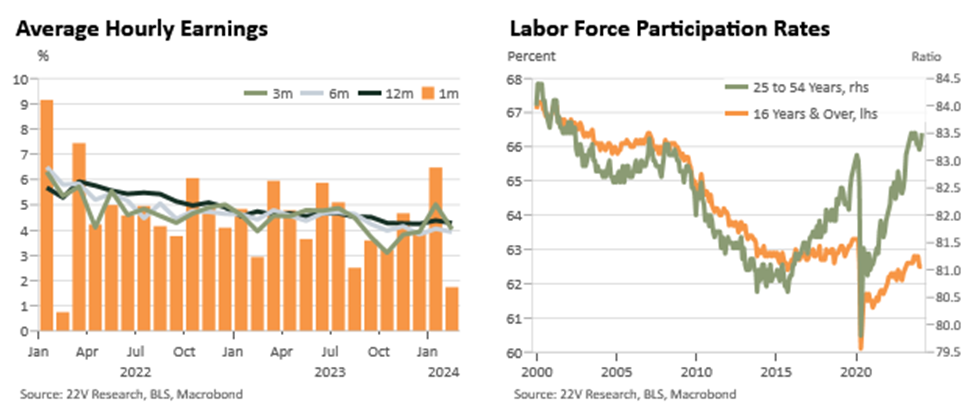
The revisions and net path over the past few months for the average workweek and average hourly earnings suggest much of January’s AHE strength was a noisy quirk, and that
The NFP’s sectoral diffusion indices (which offer different but useful read of the data) also seem to be tentatively bouncing from troughs in the fall.
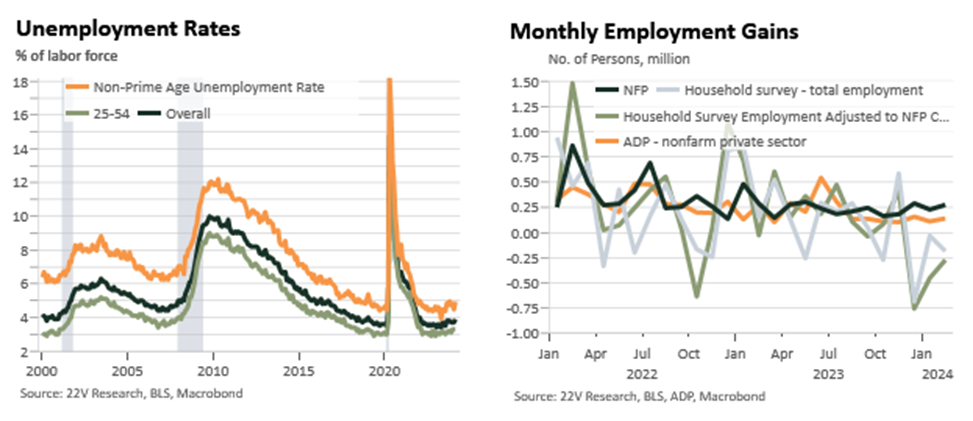
The household survey has painted a notably more pessimistic picture of the labor market but there are some bright spots in it which I weigh fairly heavily. Prime age labor force participation is back to its cycle highs and the prime-age unemployment rate has been flat at 3.3% since December. The prime-age employment to population, my favorite series from the HH survey given the fewer structural trends present in it, lower impact of seasonality, and larger sample size, is a few 1/10ths below its peak last
summer.
Turn to the Rest of the Household Survey for the Negative Read
Most all of the outright cyclically negative data in the employment report comes from the household survey.
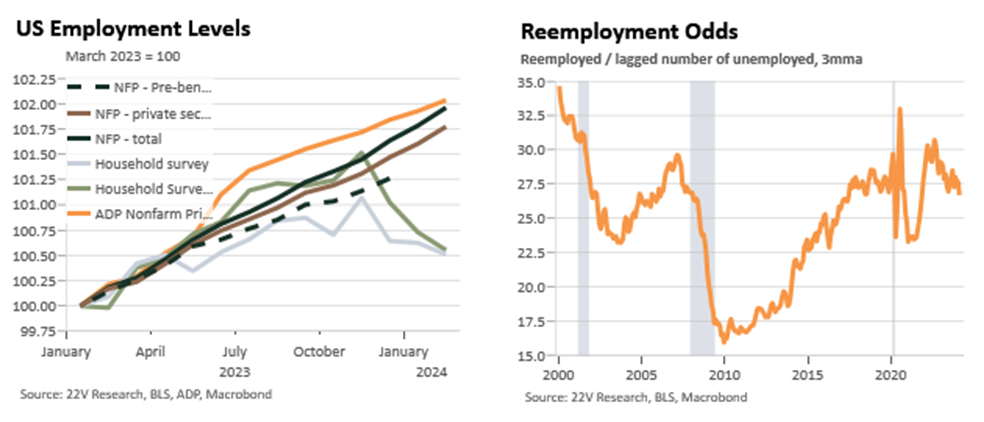
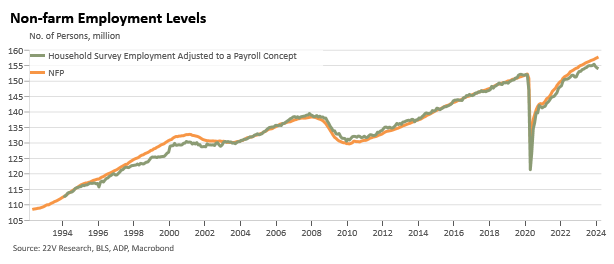
Employment growth has been negative in the HH survey the past 3 months, creating a very notable level gap with the NFP survey (and the most-optimistic ADP). The HH survey tends to be much more volatile than NFP over short samples so this gap could resolve to the upside, although gaps between the two have at times been very persistent (the late 1990s are the most similar analog; perhaps there is a link to business dynamism then which would stand in contrast with the HH survey giving higher readings right after the GFC).
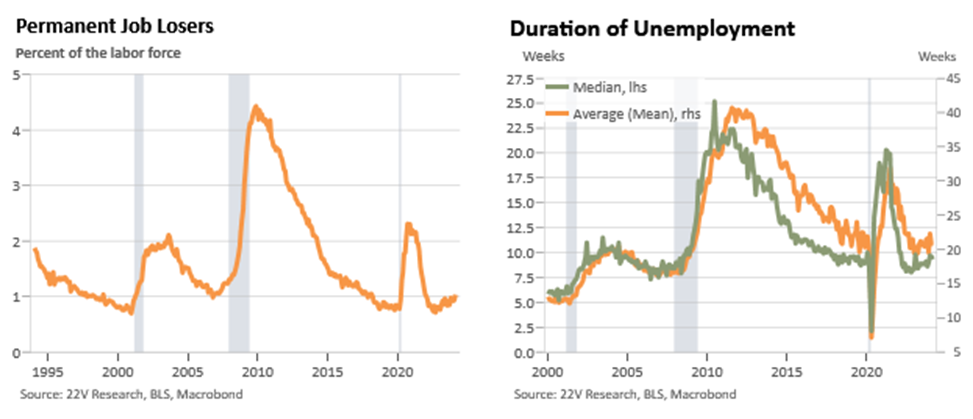
The ability of workers to be rehired seems to be declining over time in a way that does align some prior pre-recessionary patterns. Reemployment odds for laid off workers have been increasing in a very gradual way in recent months. Average and median durations of unemployment are up modestly since their troughs in late-2022 but neither was up appreciably in Feb. The share of job losers on permanent layoff has ticked up above 1% of the labor force, its highest level since early-2022.
These all are reasonable pre-recession signs based off the limited historical samples we have. I lean against them somewhat given my view on ‘churn bullwhip’ where the labor market is now in a messy re-equilibration process after the surge in hiring and quitting which took place from mid-2020-2022. Of course, the mid-to-late cycle state of the economy more broadly means that medium-term recession odds have to be somewhat elevated but I struggle to find a compelling causal story (FCIs and bank tightening seeming to turn, the ISM cycle bouncing, and housing looking robust all seem to be headed in the right direction) that suggests imminent acute weakness or outright recession, so much as continued messy a bit above trend growth.