

The Hawkish Risk Under the Rader: What if Housing Inflation Slows Less Than Anticipated?
While some slowing in shelter inflation will occur going forward there is a risk that this happens at a more gradual pace than currently assumed by most investors and the Fed.
Recent volatility in the CPI’s owner’s equivalent rents measure nicely illustrates these concerns, with OER popping notably in January. Some of this jump in OER seems likely to fade as just m/m noise but it may also be a sign of hotter single-family rents and the indirect influence of higher housing prices on the overall data. A somewhat strange email sent around from the BLS (Bloomberg article here), suggests that the weight on single family housing in the OER sample may have increased in Jan as well, which could be a somewhat more durable source of upside pressures.
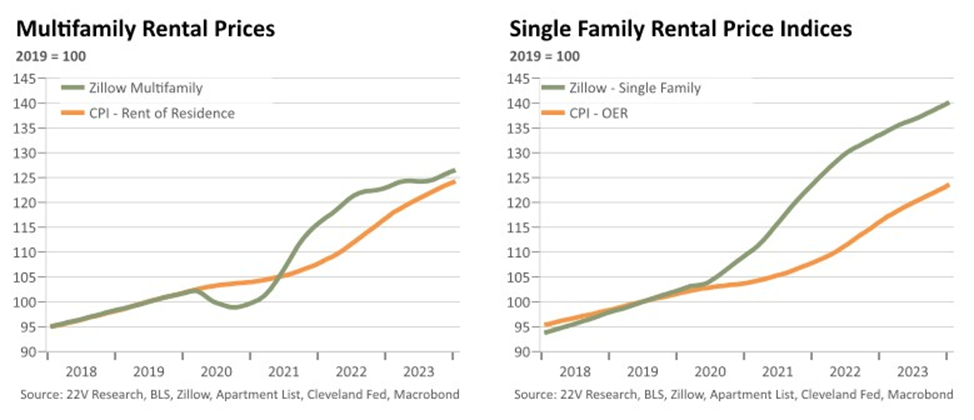
Single family rents appear to be much firmer than multifamily, where new supply is temporarily surging in 2023-24 as a result of a covid-era building boom, and this wedge, and the different weights on MFR and SFR in the samples, could be behind at least some of the persistence seen in shelter inflation so far.
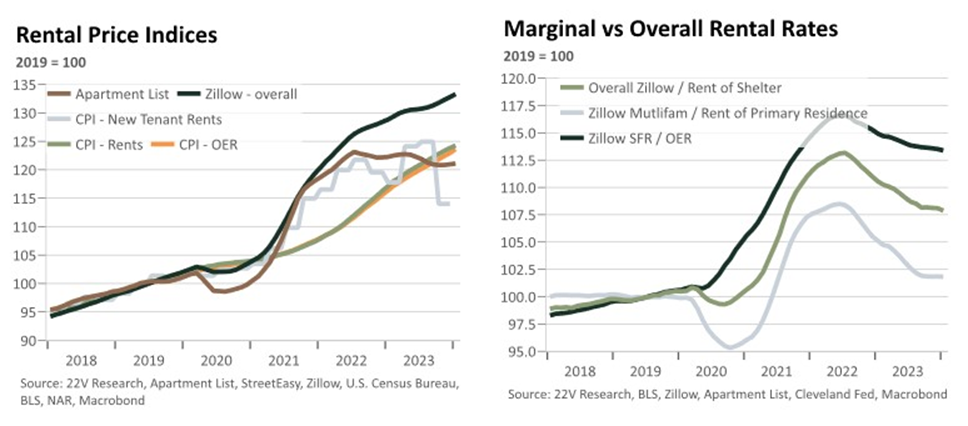
Another issue is lagged catchups in whole economy rents. Marginal rent levels based off MLS listings data are still substantially above the whole economy rents measured in the CPI; this is particularly true when imperfectly comparing single family rents and OER.
In a few different modeling exercises (detailed below) I found it challenging to generate forecasts which showed shelter inflation matching the roughly 0.3% m/m pace by end-2024 that seems to be a quasi-consensus, and never got it to its 2015-19 avg by end-2025 (something close to which seems necessary for 2% inflation’s return, especially if core goods is apt to average 0% and not the close to -1% saar it did pre-covid going forward). Of course, my modeling efforts could be missing something but my inability to get anything that seems particularly dovish when setting up the models using what I view as best practice assumptions and data inputs is concerning.
If shelter inflation declines slower than anticipated the Fed could just chose to operate off marginal rents (it has shown great willingness to switch metrics as risk management concerns and surprises in the data shift) but, in aggregate, those seem to be showing less outright disinflationary pressure now than might have been expected so this may be little solace. More likely, this seems like another risk which may make the Fed more hesitant to feel comfortable cutting in the absence of outright dovish signals.
For now, consider this more of an upside rates and inflation risk than a high conviction baseline. But like the Fed’s notably below potential GDP growth baseline, this seems another area where the risk skew relative to consensus seems clearer than trying to pinpoint an exact path.
I would note that there is little historical precedent with many of our data sources and so we should be appropriately cautious about any result, including the more dovish reads on this subject based off of linear regressions of marginal rents on CPI shelter inflation as well as the more hawkish lean shown here.
More details on rental inflation and my modeling below.
Diving into the Rental Inflation Data
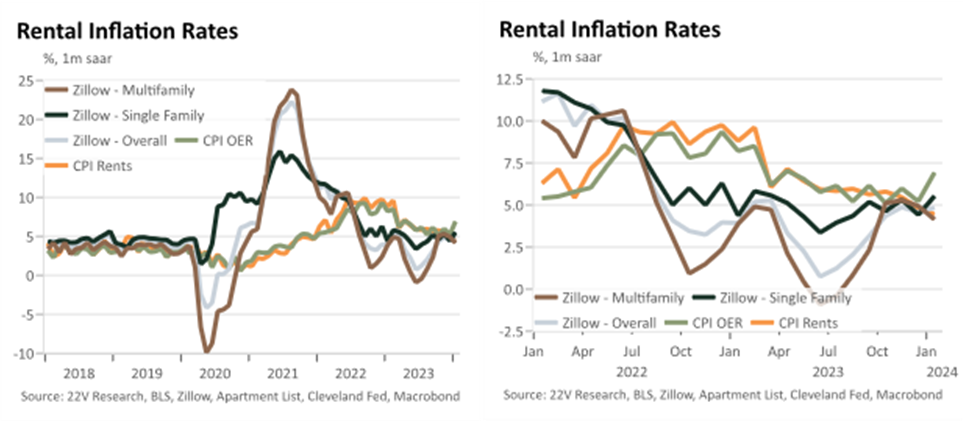
Simple regressions of lags of the Zillow rental price indices do an ok job predicting CPI shelter throughout much of the pandemic (although one needs to use 18-24 not 12 lags to really capture the lagged impacts decently well and the out-of-sample performance of these forecasts is worse, showing much less responsiveness to marginal rents, than the in-sample), in 23H2 this relationship has diverging with Zillow-implied outputs moving below realized CPI housing inflation. This is because there remains a price level gap between marginal rents and the inflation measures of whole economy rents.[1]
For some rental indices these gaps have actually fully narrowed and suggest a notably more benign shelter inflation path forward; I lean against this interpretation of the Apartment List data because of its sharp skewing towards major cities with pronounced post-covid housing bullwhips and multifamily heavy sample, and the BLS’ new tenant rent index because it’s wild Q4 drop departs sharply from all other data sources, have been suffering from acutely small samples post-covid, and in Q4 had only a few hundred new tenants included in the sample.
The Zillow indices, which use MLS realtor listing data and so could be prone to uncorrectable oversampling of larger more expensive homes, the data (along with the CoreLogic Single Family Rent Index) has historically done a good job at measuring marginal rents (See the BLS and Cleveland Fed’s joint work which led to the NTR index here for more details). These findings from the BLS have mixed implications currently. They find that often, although somewhat series dependently, marginal rents do most of the adjusting whenever there is a large departure in the levels between the any of the CPI rental measures and the marginal rent measure. However, at the current moment, this wouldn’t necessarily imply a sharp deceleration in CPI rents beyond their own momentum but rather that marginal rents should be decelerating further, a story which the data provides quite mixed signals on.
The most recent values of the CoreLogic SFRI are running around 3% on a 12m basis. This is similar to the overall Zillow rents measure (ZORI) which has seen marginal m/m rents dip from ~4-5% in early 2023, to 1% in late spring, and back up to just below 5% (the Zillow SFR measure stayed much closer to 4-5% over this span). While I assume there could be some issues with Zillow’s SA process post-covid this pattern lines up with broader economic and labor market weakness in 2023 and so I have to agree with the general story it tells. The gaps between rental of primary residence, which skews to multifamily, and owner’s equivalent rents, which skews to single family ownership, suggest that SF rents may have substantial catchup remaining while MF is close to normalized.
The January spike in OER relative to rents is likely at least partially just noise. But the multifamily vs single family weights suggest there could be some signal here. BLS responses to private sector queries which have circulated suggest that the weight to SF did jump relative to MF in Jan which is unlikely to fade in the near-term, and builds of a trend towards a higher SF weight in recent years (here). Normally these issues have had the effect of imparting an upwards bias to overall CPI shelter inflation (here) but the mechanism seems reversed now.
A Few Different Modeling Approaches
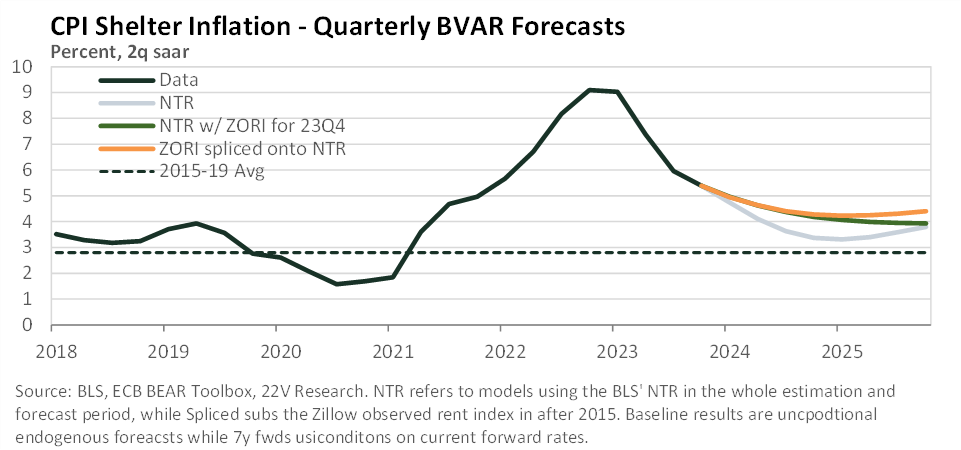
My baseline model is a quarterly Bayesian VAR (vector autoregression) which includes the following data: the 7y UST, mortgage spreads to the 7y, average hourly earnings of production and non-supervisory workers, the FHFA home price index, a measure of new leases, and CPI rent of shelter inflation. The results here highlight the risks mentioned above. I run 3 different forecast simulations using the above model.[2]
- I use the BLS’ new tenant rent index including the somewhat suspect Q4 NTR print. This results in the most dovish forecasts with shelter inflation dipping to around 3.5% by end-24. If I incorporate into the forecasts the 7y forward rates[3], which the model seems to interpret as better growth outcomes rather than hawkish policy shocks, then the results are largely the same in the near-term but pick up over the medium-term.
- Given issues with the recent NTR prints, I sub in the Zillow rental index starting in 2015, when it becomes available. The results skew notably more hawkish with shelter inflation never dipping below 4%.
- To split the difference, I use NTR through 23Q3 then assume it grew at the ZORI pace in Q4.
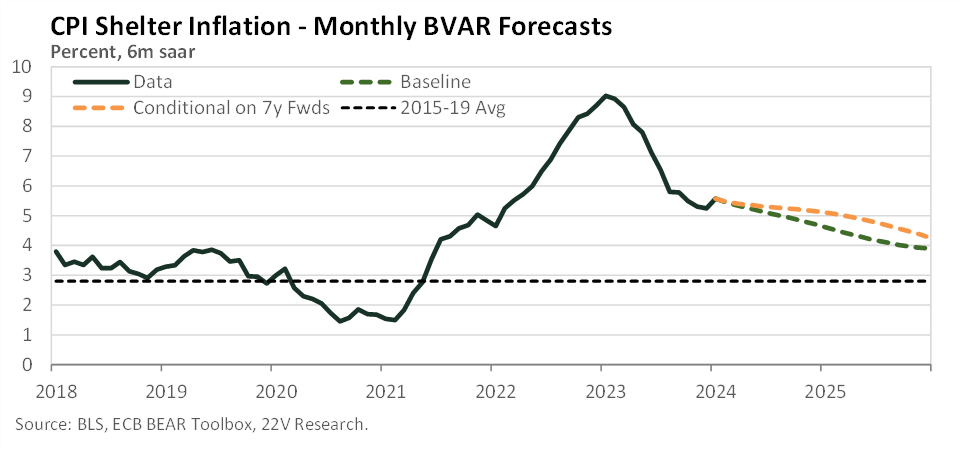
As an alternative, but to be weighted notably less heavily given the very short sample covered, I do a similar monthly modeling exercise using 6 lags of the 7y, mortgage spreads, the FHFA home price index, the multi- and single-family Zillow rental indices, and CPI shelter inflation (the price indices are all in 6m saar changes). Unfortunately, the Zillow data only goes back to 2015.
Given the very short sample this modeling should not be weighted too heavily but the results are qualitatively similar, if somewhat more hawkish and inertial, than the quarterly results above (I hope that Bayesian priors chosen to be fairly close to the results of the above exercise ameliorate some of these concerns but cannot eliminate them). The results remain concerning, even if appropriately discounted, given the level of inertia shown and failure of CPI shelter inflation to drop notably below 4% in 2024-25.
While ~60% of leases are 12m in length, ~30% are month to month usually after their initial 12m length is over. This makes assessing the average effective length of leases quite challenging but suggests quite a long tail for marginal rental updating, especially in the typically less professionally managed single-family market (from the BLS here). There is also a positive relationship between house prices and rental inflation (Dallas Fed here and SF Fed here), even though the theory suggests that rents should be driven by overall ownerships costs. ↑
The results reported are the medians from 100k iterations with a burn-in period of 75k to help increase the power of the model’s estimation while hopefully helping to partially ameliorate the impacts of the Bayesian priors and the small sample sizes. ↑
I use the tilting methodology where the model finds the scenarios of the other series most closely aligned with the conditioning forecast, rather than treating the higher 7y rates as a policy shock. ↑

