SUMMARY: It is tough to be short speculative companies if 10yr yields are higher on better economic growth prospects AND the Fed has officially removed its tightening bias. A limited positive growth shock is not a problem (see below on what level economic growth becomes a problem). An inflation shock would be. This is why we have argued for a decline in the negative correlation between 10yr yields and stocks. This has already happened at the S&P level and could be starting to happen in riskier areas of the market (like small caps). What we describe is likely part of the reason crowded shorts (debt baskets, small caps, etc.,) or VIP hedge fund short baskets have had such strong performance recently.
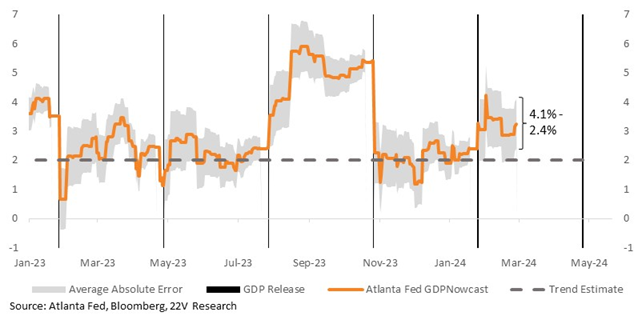
What Level of Growth Is a Problem For Risk: As Peter Williams pointed out Monday (HERE), if the Fed were to assume a 2024 growth forecast of 2.75%ish or above, policy could become outright hawkish, rather than less dovish. 2.75% would be +100bps above their current view of long-run potential. It is a long year and WE SHOULD NOT EXTRAPOLATE the current 1Q24 Atlanta Fed Nowcast to full year 2024 (that would be really hawkish. Current reading is 3.24%). But it is important to monitor.
Short Term 10yr Yields Higher Risk: Another Good Point from Peter Williams. If the hot inflation data in Jan was largely a product of residual seasonality as some of the doves have been saying, that residual seasonality likely carries over some to February. That adds some upside risk to consensus on CPI next month. The time to get long rates, if you believe the seasonality argument, is later in March after the Feb CPI. Not before.
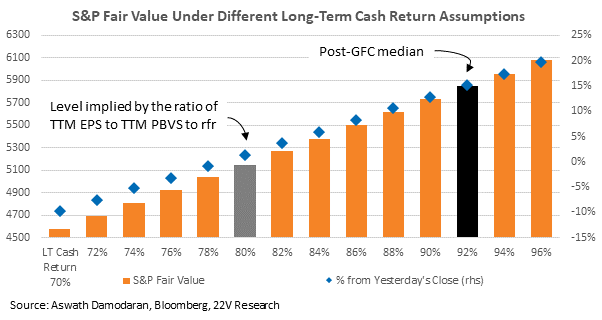
Fair Value Update: Assuming the 4.5% ERP estimate and cash returns remain around current levels, the fair value for the S&P, applying Professor Damodaran’s discounted cash return equity risk premium methodology (HERE), is currently 5170, which is less than 2% higher than yesterday’s close. Not very exciting from a forward return perspective.
The Upside Fair Value Risk: Current cash return (dividend + buyback relative to the S&P TTM net income and cash flow) is currently 76.5%. That is what we use in our fair value calculation. That is below the long term median of 80% and well below the post-GFC median of 90%. If the monopolistic characteristics of the top quintile of S&P names (the ones that contribute the most to buybacks) remain in place, cash returns as a % of net income and cash flow are likely headed higher. FYI, if we assume the post-GFC median cash return of 90%, S&P fair value is significantly higher (5900). We are not saying that will happen, but directionally, higher buybacks as a % of net income seems more likely than lower.

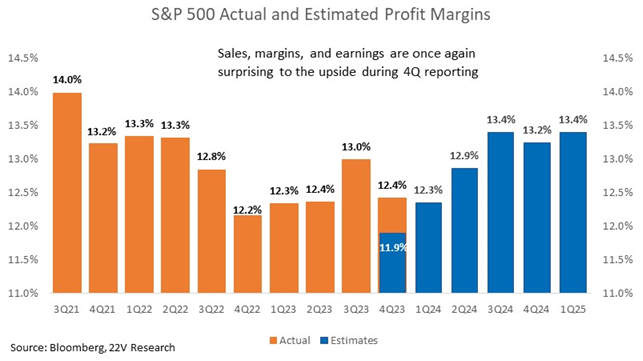
MARKET VIEWS: Economic data still fine, despite higher 10yr yields and financial conditions near December 2023 lows, making being short the typical higher interest rate losers (small caps, earnings risk, banks) tougher. We would expect the average stock to outperform if higher 10yr yields are associated with positive economic growth, vs inflation shock. Earnings will continue to move higher, and margins are improving as economic estimates get revised higher. What we describe is likely part of the reason crowded or VIP hedge fund short baskets had such strong performance yesterday. It’s tough to be short more speculative companies if 10yr yields are up on better economic growth prospects.
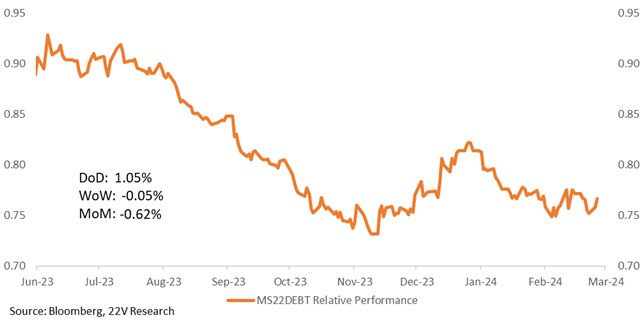
10yr Upside Risk Near Term: Peter Williams made an important point on CPI data. If the hot inflation data in Jan was largely a product of residual seasonality as some of the doves have been saying, that residual seasonality likely carries over some to February. That should add some upside risk to consensus on CPI next month. The time to get long rates, if you believe the seasonality argument, is later in March after the Feb CPI. Not before. The 22V Debt risk basket relative performance has been stable for a month. If the Debt sustainability basket has a negative relative performance divergence on higher 10yr yields, that would indicate 10yr yields are going up for the wrong reasons (inflation risk).
What Level of Economic Growth Is a Problem: The Atlanta Fed GDPNowcast increased to 3.24% yesterday from 2.9%. If that was sustained, for all of 2024, that would be a problem. FYI, our forecast is 2-2.5% real GDP Growth and as Peter Williams pointed out Monday (HERE), if the Fed were to assume a 2024 growth forecast of 2.75%ish or above, policy could become outright hawkish, rather than less dovish. 2.75% would be +100bps above their current views of long-run potential. So, Peter assumes the Fed would allow for continued near-term supply side improvements. I.e., the speed limit has shifted up. It is a long year and WE SHOULD NOT EXTRAPOLATE the current 1Q24 Atlanta Fed Nowcast to full year 2024 (that would be really hawkish). But it is important to monitor.
Fair Value Update: Applying Professor Damodaran’s equity risk premium calculation methodology (HERE), which regards current index value as discounted future cash return, current S&P ERP is around 4.5%. We would expect the ERP to remain around current levels if the economic backdrop is more like the pre GFC period, vs the post GFC period. The post GFC period was defined by private sector deleveraging, consistent disinflation risk and unusually high ERP’s.
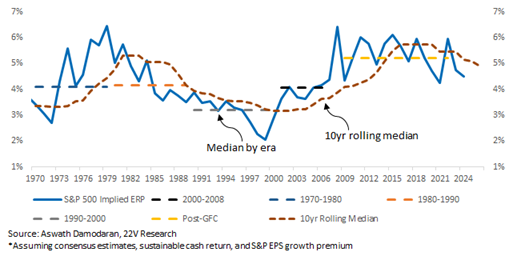
Assuming the 4.5% ERP estimate and current expected cash returns remain around current levels, the fair value for the S&P, using the discounted cash return methodology, is currently 5170, which is less than 2% higher than the close price yesterday. As we pointed out last week, investor sentiment is above the 75th %tile relative to the breadth of data, suggesting lower than normal forward returns for the S&P on a 1/3/6 month basis. Our fair Value framework and elevated sentiment relative to economic data is consistent with our call that the S&P is likely to be range bound near term.
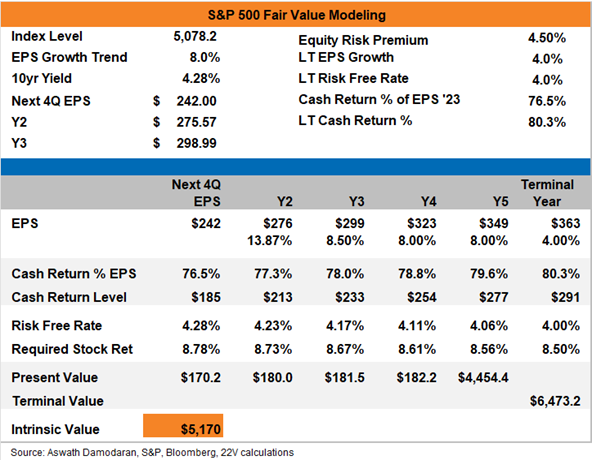
The Upside Risk to Fair Value: The current cash return (dividend + buyback relative to the S&P TTM net income and cash flow) is currently 76.5%. That is below the long term median of 80% and well below the post GFC median of 90%. If the monopolistic characteristics of the top quintile of S&P 500 names (the ones that most contribute to buybacks) is going to remain for much longer, cash returns as a % of net income and cash flow is likely headed higher. Buybacks are already increasing. FYI, if we assume the post GFC median cash return of 90%, S&P fair value is significantly higher (5900). We are not saying that will happen, but directionally, higher on buybacks as a % of net income seems much more likely than lower.