Back Economics

The limited gist of the GDP revision

Published on February 28, 2024

∙ Download the PDF Report

By

Gerard MacDonell

This note does not present a rote rundown of the revised GDP data for the fourth quarter. I am sure you can get that from other sources.  Instead, it focuses on what I take to be the two main takeaways, which are not particularly incremental, but lean on the side of demand growth remaining firm. 

First, the two quarter change of final sales to private domestic purchasers (FSPDP) is now reported to be running at 2.9% (ar), which is well above trend.  And there is no evidence in the trailing data of any tendency to accelerate or decelerate through the half year, as the Q3 and Q4 growth rates there are virtually the same.

I like to follow a kludge that is meant to apply the GDP vs GDO comparison to final sales of domestic purchasers, by assuming that the statistical discrepancy is distributed proportionately across the various components of aggregate demand. That generates a 2-quarter growth rate of 2.1%, which is not so far above trend. However, the Q4 figure looks stronger than the Q3 figure within that calculation. And separately, there are reasons to suspect that GDI and GDO are identifiably downward biased in recent quarters. So, I think a reasonable best guess is that we should be working with the assumption that final sales to private domestic purchasers has been growing at about 2 ½% during the past two quarters, with some marginal tendency to accelerate, simply because I have no basis for dialing down the headline FSPDP growth rate on the basis of a change of the statistical discrepancy. This involves a kludge, as mentioned, but as often I am going for less wrong.

[1]

Not much has changed here, including in cycle-to-date terms

A group of graphs showing different types of data

Description automatically generated
Source: BEA, NBER, FH calculations
Data are as revised to Q4.

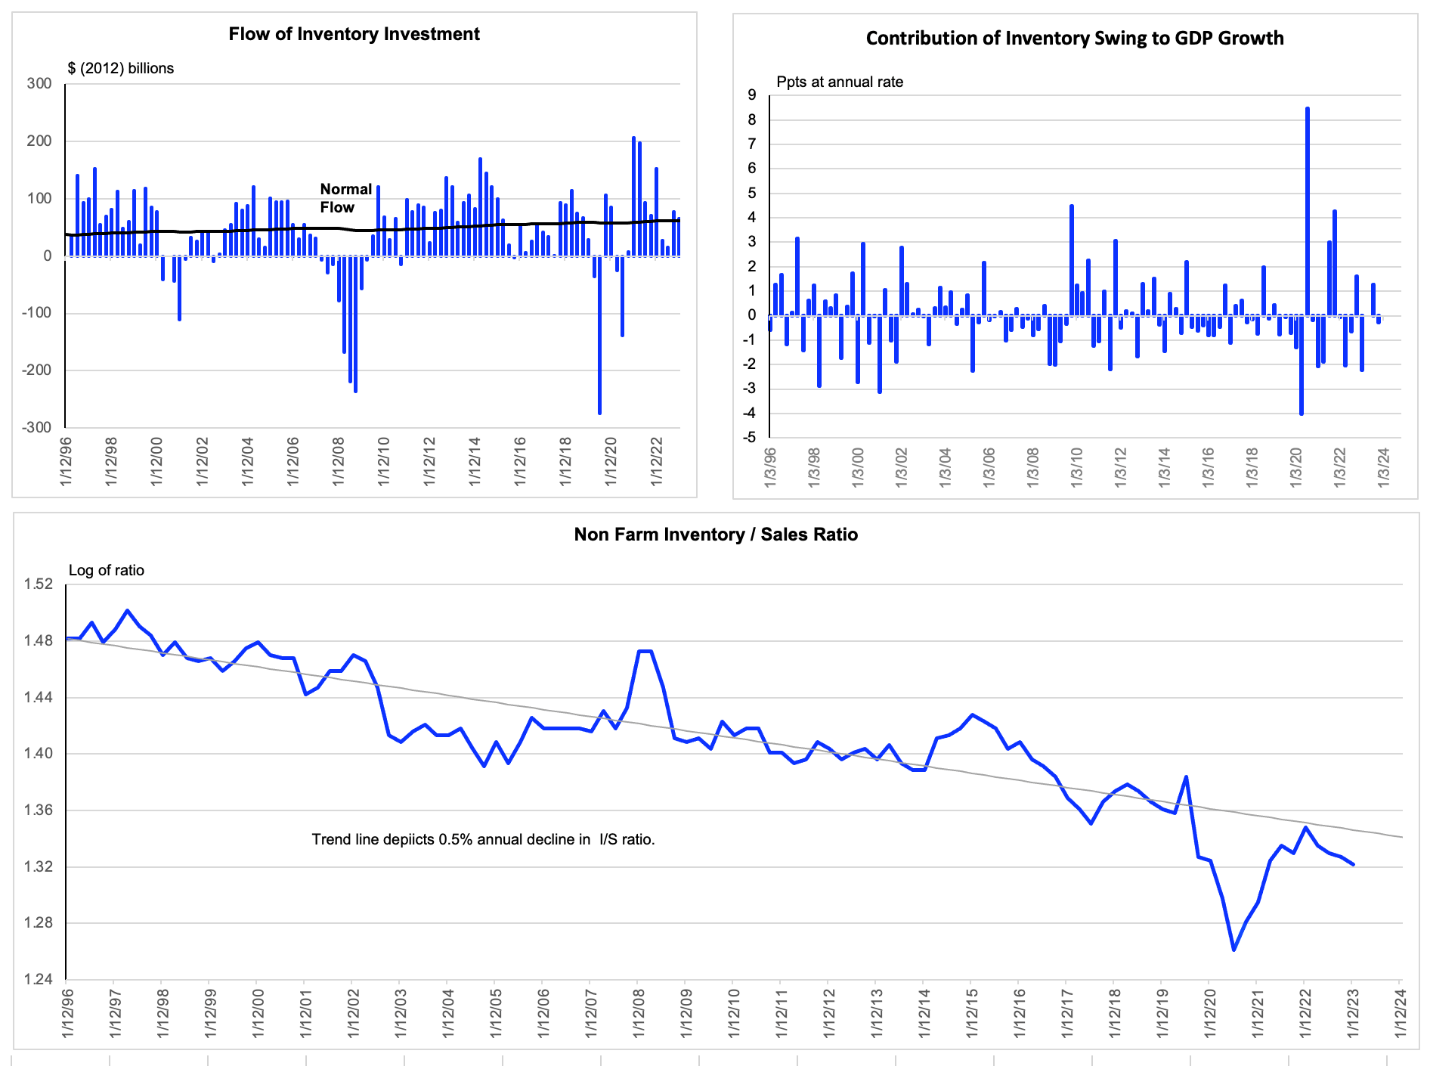
Second, the flow of inventory investment was revised down, which meant that the swing in that flow chopped almost 30 bps (ar) off the total demand growth rate (ignoring knock ons to inventory demand which would provide a minor offset).  As a result of this, though, the flow of inventory investment is now virtually indistinguishable from “normal,” which I have defined several times in earlier notes, a process I will not reiterate here.  Accordingly, there is neither a pent-up demand nor pent-up pothole from this source.  Previously, it looked like there was a very minor pothole to develop there. 

Meanwhile, the inventory/sales ratio remains below its slowly declining secular trend line.  This reinforces the point made immediately above for those who think the level of inventories is a relevant variable for timing the impetus or drag from the inventory cycle. But I am not among such people, again for reasons I have discussed in earlier notes. If anything, the signal from the level of the I/S ratio is often backwards to the coming impetus or drag from the inventory cycle.  But I am a full service economist, so I report the ratio anyway. 

The bottom panel is just to complete the thought
A graph of a graph of a graph of a graph of a graph of a graph of a graph of a graph of a graph of a graph of a graph of a graph of a graph of

Description automatically generated
Source: BEA, FH calculations
Data are as revised to Q4.

[1]  We do not yet have data on GDI for Q4. Accordingly, there is also no estimate of GDO, which is the average of GDP and GDI. But for the purposes of this exercise, I assume that GDP and GDI (and thus GDO) grew at the same rate during Q4.


DISCLOSURES AND DISCLAIMERS

Analyst Certification

The analyst, 22V Research Group, primarily responsible for the preparation of this research report attests to the following: (1) that the views and opinions rendered in this research report reflect his or her personal views about the subject companies or issuers; and (2) that no part of the research analyst’s compensation was, is, or will be directly related to the specific recommendations or views in this research report.

Analyst Certifications and Independence of Research.

Each of the 22V Research analysts whose names appear on the front page of this report hereby certify that all the views expressed in this Report accurately reflect our personal views about any and all of the subject securities or issuers and that no part of our compensation was, is, or will be, directly or indirectly, related to the specific recommendations or views of in this Report.

22V Research (the “Company”) is an independent research provider. The Company is not a member of the FINRA or the SIPC and is not a registered broker dealer or investment adviser. 22V Research has no other regulated or unregulated business activities which conflict with its provision of independent research.

22V Research, LLC is a professional services and independent publication organization. 22V Research, LLC is not a securities broker-dealer, not a member of the Financial Industry Regulatory Authority (FINRA), not a registered investment advisor (RIA) and not a member of SIPC.

Securities transactions, when offered, are offered by 22V Securities, LLC through LPS Capital, LLC. Certain employees of 22V Securities, LLC are dually registered as securities representatives of LPS Capital, LLC or Analyst Hub Securities, LLC. 22V Securities, LPS Capital and Analyst Hub Securities are members FINRA, SIPC.

https://brokercheck.finra.org/

Current Ratings Definition.

SECTOR OUTPERFORM: An “outperform” rating anticipates the company will outperform the S&P Regional Banking Index (peer group).

SECTOR PERFORM: A “market perform” rating anticipates the company will perform in line with the S&P Regional Banking Index (peer group).

SECTOR UNDERPERFORM: An “underperform” rating anticipates the company will underperform the S&P Regional Banking Index (peer group).

Limitation Of Research And Information.

This Report has been prepared for distribution to only qualified institutional or professional clients of 22V Research Group. The contents of this Report represent the views, opinions, and analyses of its authors. The information contained herein does not constitute financial, legal, tax or any other advice. All third-party data presented herein were obtained from publicly available sources which are believed to be reliable; however, the Company makes no warranty, express or implied, concerning the accuracy or completeness of such information. In no event shall the Company be responsible or liable for the correctness of, or update to, any such material or for any damage or lost opportunities resulting from use of this data. Nothing contained in this Report or any distribution by the Company should be construed as any offer to sell, or any solicitation of an offer to buy, any security or investment. Any research or other material received should not be construed as individualized investment advice. Investment decisions should be made as part of an overall portfolio strategy and you should consult with a professional financial advisor, legal and tax advisor prior to making any investment decision. 22V Research Group shall not be liable for any direct or indirect, incidental or consequential loss or damage (including loss of profits, revenue or goodwill) arising from any investment decisions based on information or research obtained from 22V Research Group.

Reproduction And Distribution Strictly Prohibited.

No user of this Report may reproduce, modify, copy, distribute, sell, resell, transmit, transfer, license, assign or publish the Report itself or any information contained therein. Notwithstanding the foregoing, clients with access to working models are permitted to alter or modify the information contained therein, provided that it is solely for such client’s own use. This Report is not intended to be available or distributed for any purpose that would be deemed unlawful or otherwise prohibited by any local, state, national or international laws or regulations or would otherwise subject the Company to registration or regulation of any kind within such jurisdiction.

Copyrights, Trademarks, Intellectual Property.

22V Research Group, and any logos or marks included in this Report are proprietary materials. The use of such terms and logos and marks without the express written consent of 22V Research Group is strictly prohibited. The copyright in the pages or in the screens of the Report, and in the information and material therein, is proprietary material owned by 22V Research Group unless otherwise indicated. The unauthorized use of any material on this Report may violate numerous statutes, regulations and laws, including, but not limited to, copyright, trademark, trade secret or patent laws.