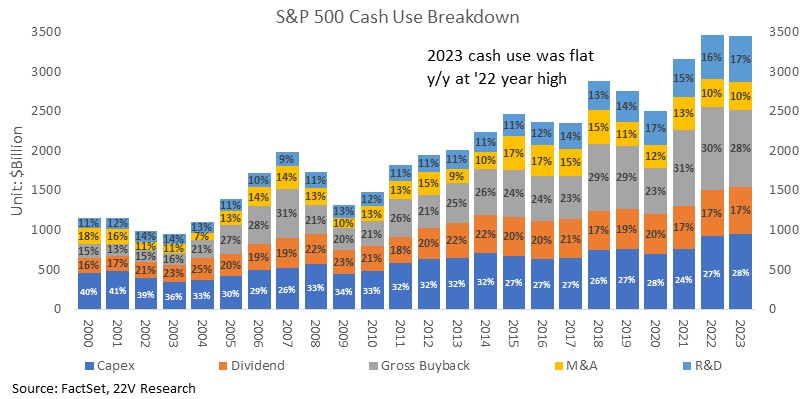
Bottom Line: S&P company cash spending was roughly flat in 2023 even as EPS contracted about -3% y/y. Dividends were up 4%, but buyback spending was down about -15%, with most of the weakness coming from the first half. Buyback spending tends to be correlated to earnings growth trends, so some weakness last year was expected. Since 2H23, S&P EPS growth has turned positive, economic tail risks have eased, and buyback activity started to accelerate.
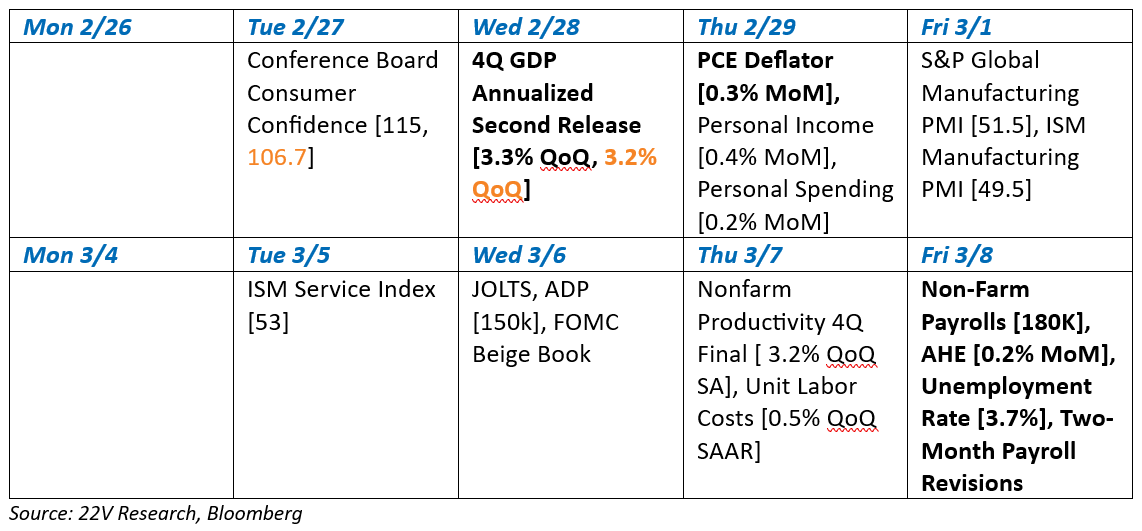
Relevant News: Not too large a shift in the headline numbers for the GDP revisions (3.3% QoQ expected, 3.2% QoQ actual) but the composition of growth looks better now. Personal spending and fixed investment were both revised up with gov’t spending revised down, taking final sales to domestic purchasers (analog to core GDP) to 3.1% from 2.7%. Q4 PCE inflation was revised up 16bps from 1.66% QoQ SAAR to 1.82%, but this was all in goods and less concerning than if it had been services driven in 22V’s economists’ opinion.
Things to Watch [Consensus, Results]:
Quant: Cash Return Rebounding
2023 cash spending by S&P companies was roughly flat relative to 2022 despite macro headwinds and the -3% y/y contraction in EPS. Most categories were steady while R&D spending jumped 12%, driven by Health Care and Discretionary. M&A also perked up, expanding 10% y/y and 100% h/h. All the above is consistent with the easing of macro headwinds and the general improvement in earnings sentiment readings across the index.
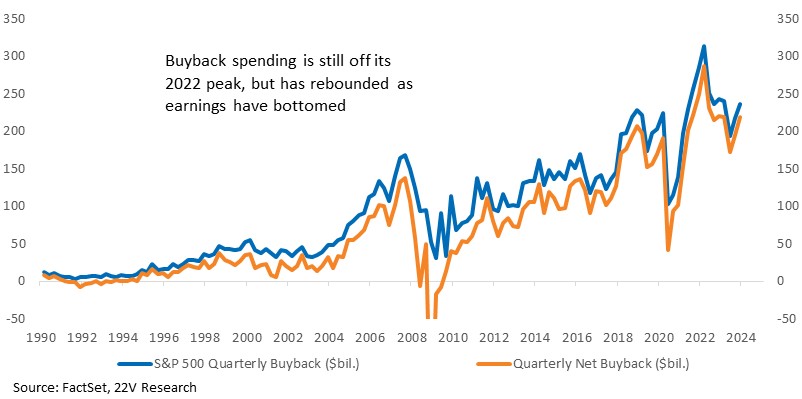
Focusing on buybacks, spending in the first half of 2023 fell -25% y/y as earnings contracted and macro uncertainty peaked. In the second half, spending rebounded and ended flat relative to 2022. Buyback spending tends to be correlated to earnings growth trends, so some weakness last year was expected. S&P EPS is expected to expand 9-10% in 2024, setting the stage for a rebound in buybacks.
Mega cap names cash return yield is broad with the yields within more than half of sectors >4%. Within the small cap universe, Technology has a higher yield than larger cap names. Industrials, Financials, and REITs also have better yields than non-mega S&P names.

Portfolio Strategy: Upside Fair Value Risk
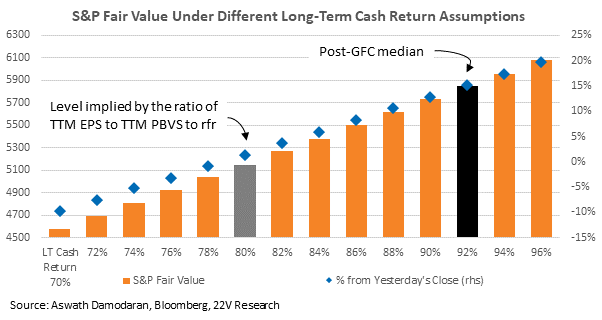
Current cash return (dividend + buyback relative to the S&P TTM net income and cash flow) is currently 76.5%. That is what we use in our fair value calculation. That is below the long-term median of 80% and well below the post-GFC median of 90%. If the monopolistic characteristics of the top quintile of S&P names (the ones that contribute the most to buybacks) remain in place, cash returns as a % of net income and cash flow are likely headed higher. Currently, S&P fair value is 5170, which is less than 2% higher than yesterday’s close. Not very exciting from a forward return perspective. FYI, if we assume the post-GFC median cash return of 90%, S&P fair value is significantly higher (5900). We are not saying that will happen, but directionally, higher buybacks as a % of net income seems more likely than lower.
Washington Policy: The House of Representatives Remains the Fiscal Indicator
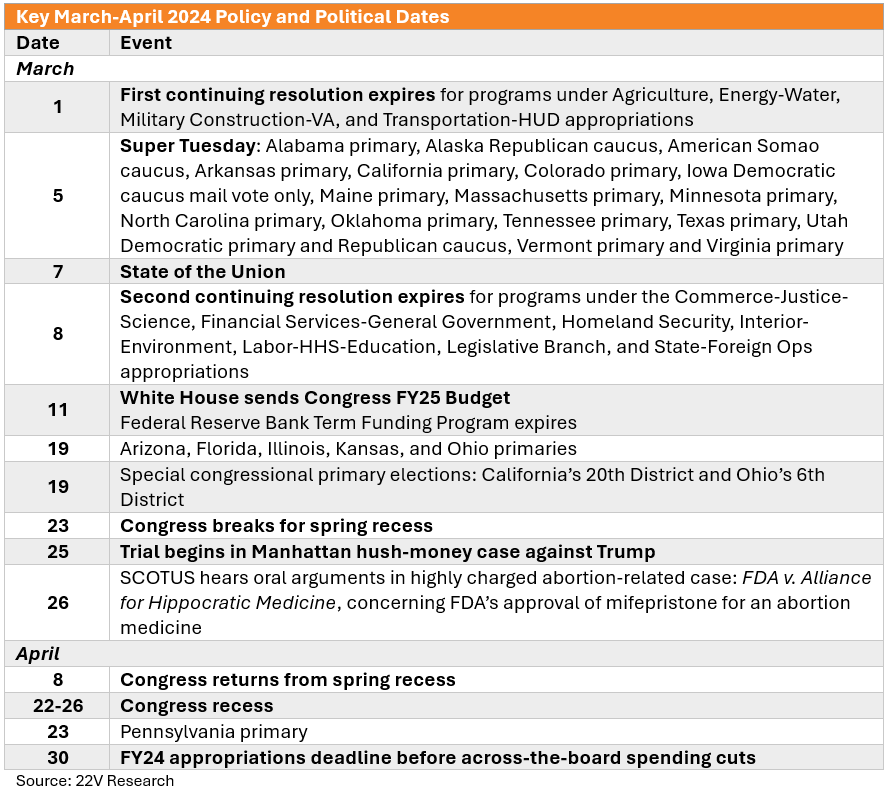
22V’s Washinton Policy analyst believes that the next six to eight weeks of DC fiscal policy will have a greater impact on geopolitics, and consequently, the November elections than to markets. The guardrails preventing that level of fiscalamity rest on the base of electoral risks and related prevailing will. The team updates their rolling two-month calendar to spotlight domestic political milestones and the scheduled congressional breaks. The fiscal deadlines on March 1 and 8 frame Super Tuesday and the State of the Union address, providing additional depth to our risk conflation thesis.