Back European Strategy/Geopolitics

Understanding The Labor Productivity Challenge in Europe (and boom in the US)

Published on February 26, 2024

∙ Download the PDF Report

By

Jacob Funk Kirkegaard

Labor productivity in Europe is very weak, and as discussed in earlier notes, to the degree that it is likely to bias the ECB against cutting rates too early or too fast. While all productivity outcomes are the result of the complex functioning of modern economies, there are at least five principal reasons for why European labor productivity is so weak right now, especially relative to the United States. Labor productivity is not likely to grow much faster in Europe in the coming years.

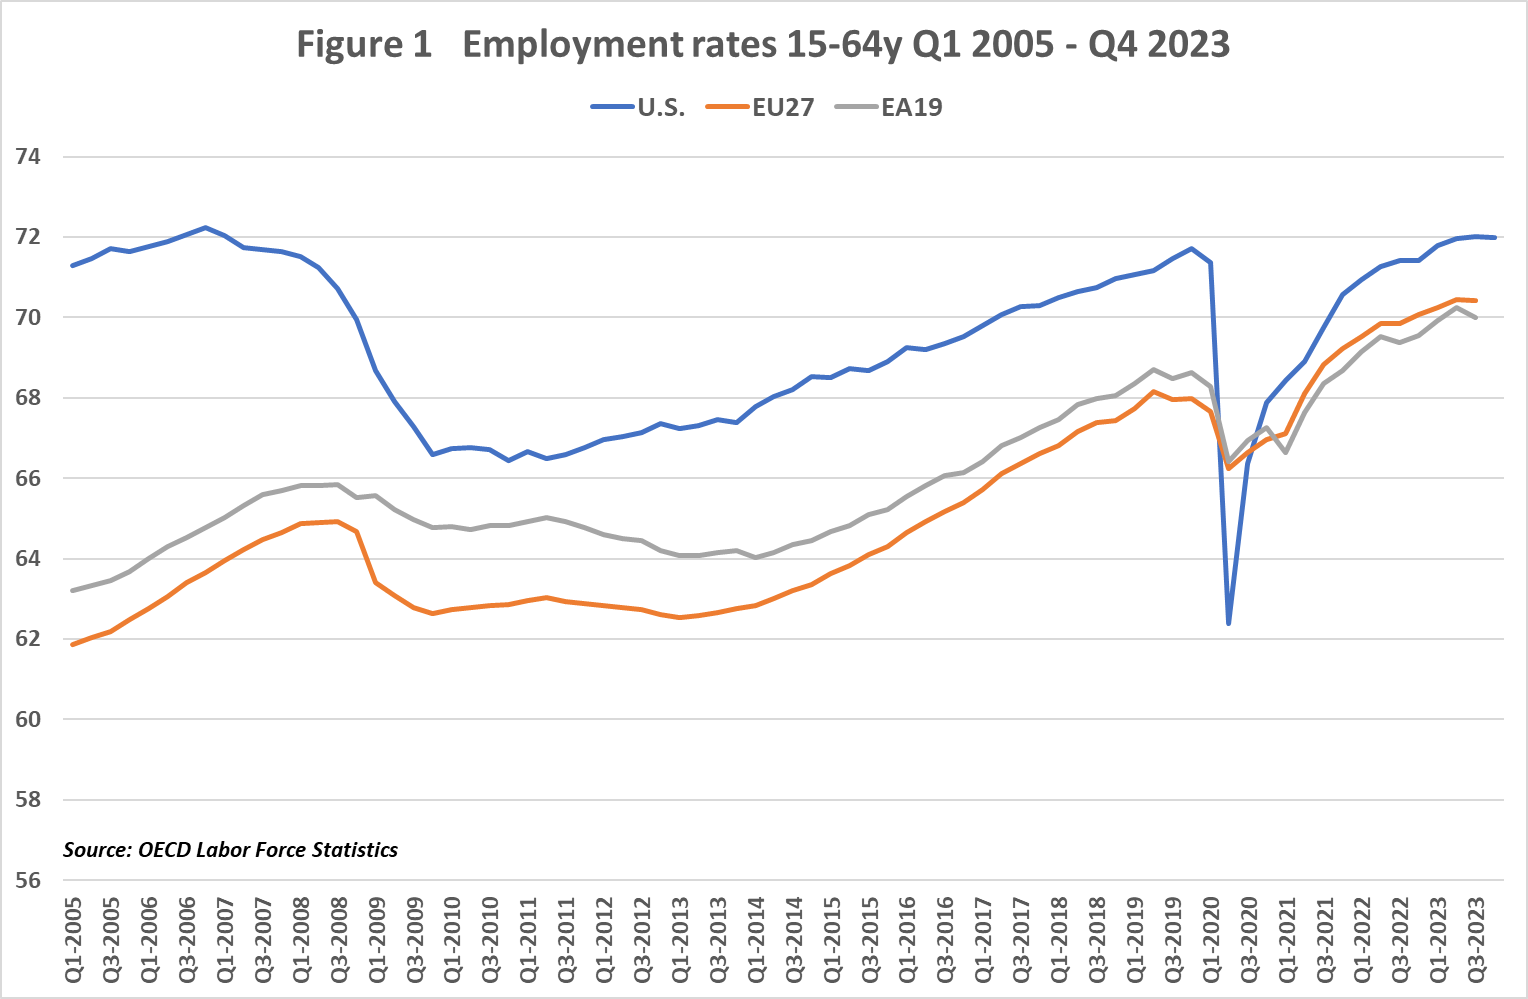
  1. Increased employment; The EU has, despite flat growth since mid-2022 seen continued increased employment, continuing a rising post-GFC trend. As figure 1 shows, the employment rate differential between the United States and EU is now much lower than in earlier times. This means that a lot of people with limited work experience and correspondingly low productivity has been brought into employment in the EU, reducing the recorded average labor productivity. Low current labor productivity in the EU is therefore today partially reflecting “good employment news” from “job rich EU growth”, but also that there is no such thing as a free lunch when it comes to macroeconomic outcomes. over time, the productivity of newly employed “marginal workers” in the EU will rise, but this will take years and likely require increased capital investments.
A graph of a graph with numbers and a number of people

Description automatically generated with medium confidence
  1. Low corporate investments; CAPEX in Europe has been quite low in many member states for many years. Reflecting the business structure with many SMEs and small family-owned businesses, many are often too small to undertake adequate CAPEX and reap economies of scale, reducing overall labor productivity levels. Similarly, EU capital markets not fully developed, so many firms often find costs of capital too high. This is a particular problem in times when banks are under financial pressure (not the case now, but during the euro crisis and during the in the negative nominal rate era until 2022 it was) and more reluctant to lend. Europe’s bank centered financial system and higher cost of capital for many firms is also part of the reason for low investment levels.
  1. Labor regulation issues; these continue to be a barrier to rising productivity, even if perhaps less so than earlier. This is noticeably an issue in periods of “disruptive technologies” like IT, AI or green tech, requiring that you reorganize your entire firm to fully reap the benefits from these innovasions. This is harder in Europe than in the US, with regulations often not just making it harder to fire workers, but also more difficult to reassign them to new tasks, dragging long term productivity down in the process.
  2. Covid responses; the US has ended up in a very good macroeconomic position for productivity after Covid. It had enormous labor market dislocation during Covid and now massive fiscal stimulus including investment subsidies, generating job opportunities for those dislocated during Covid in (generally) higher paying jobs. This is a very very good cocktail for labor productivity in the US, and one that Europe has not experienced. Europe relied on wage subsidies for existing jobs during Covid and hereby minimized labor market dislocation and shifts into higher paying jobs. Europe also today has a far smaller fiscal stimulus and arguably too tight a monnetary policy stance to spur investments to generate many new higher paying jobs. 
  3. Country variations; labor productivity is meaningfully only measured at market exchange rates (rather than PPP) and output per hour. This makes the poorer EU members invariably perform much worse than the United States (figure 2), while the richer Western European members generally are close to US levels (and a number of smaller ones well above). This is too a degree a “levels issue” from lower GDP, but recorded dynamic growth will also be low in poorer EU members.
A graph of a number of employment rates

Description automatically generated

In figure 2, Ireland (tax domicile), Luxembourg (financial center) and Norway (oil) should likely be ignored, but as can be seen Germany and France are quite close to US levels, while the productivity levels problem lies mostly in Southern and Eastern Europe. The fact that US GNI/hour worked is lower than GDP is one of the ways the very large US investment deficit manifests itself. Noticeable too in a per hour basis is the very low levels of labor productivity in both Japan and South Korea.


DISCLOSURES AND DISCLAIMERS

Analyst Certification

The analyst, 22V Research Group, primarily responsible for the preparation of this research report attests to the following: (1) that the views and opinions rendered in this research report reflect his or her personal views about the subject companies or issuers; and (2) that no part of the research analyst’s compensation was, is, or will be directly related to the specific recommendations or views in this research report.

Analyst Certifications and Independence of Research.

Each of the 22V Research analysts whose names appear on the front page of this report hereby certify that all the views expressed in this Report accurately reflect our personal views about any and all of the subject securities or issuers and that no part of our compensation was, is, or will be, directly or indirectly, related to the specific recommendations or views of in this Report.

22V Research (the “Company”) is an independent research provider. The Company is not a member of the FINRA or the SIPC and is not a registered broker dealer or investment adviser. 22V Research has no other regulated or unregulated business activities which conflict with its provision of independent research.

22V Research, LLC is a professional services and independent publication organization. 22V Research, LLC is not a securities broker-dealer, not a member of the Financial Industry Regulatory Authority (FINRA), not a registered investment advisor (RIA) and not a member of SIPC.

Securities transactions, when offered, are offered by 22V Securities, LLC through LPS Capital, LLC. Certain employees of 22V Securities, LLC are dually registered as securities representatives of LPS Capital, LLC or Analyst Hub Securities, LLC. 22V Securities, LPS Capital and Analyst Hub Securities are members FINRA, SIPC.

https://brokercheck.finra.org/

Current Ratings Definition.

SECTOR OUTPERFORM: An “outperform” rating anticipates the company will outperform the S&P Regional Banking Index (peer group).

SECTOR PERFORM: A “market perform” rating anticipates the company will perform in line with the S&P Regional Banking Index (peer group).

SECTOR UNDERPERFORM: An “underperform” rating anticipates the company will underperform the S&P Regional Banking Index (peer group).

Limitation Of Research And Information.

This Report has been prepared for distribution to only qualified institutional or professional clients of 22V Research Group. The contents of this Report represent the views, opinions, and analyses of its authors. The information contained herein does not constitute financial, legal, tax or any other advice. All third-party data presented herein were obtained from publicly available sources which are believed to be reliable; however, the Company makes no warranty, express or implied, concerning the accuracy or completeness of such information. In no event shall the Company be responsible or liable for the correctness of, or update to, any such material or for any damage or lost opportunities resulting from use of this data. Nothing contained in this Report or any distribution by the Company should be construed as any offer to sell, or any solicitation of an offer to buy, any security or investment. Any research or other material received should not be construed as individualized investment advice. Investment decisions should be made as part of an overall portfolio strategy and you should consult with a professional financial advisor, legal and tax advisor prior to making any investment decision. 22V Research Group shall not be liable for any direct or indirect, incidental or consequential loss or damage (including loss of profits, revenue or goodwill) arising from any investment decisions based on information or research obtained from 22V Research Group.

Reproduction And Distribution Strictly Prohibited.

No user of this Report may reproduce, modify, copy, distribute, sell, resell, transmit, transfer, license, assign or publish the Report itself or any information contained therein. Notwithstanding the foregoing, clients with access to working models are permitted to alter or modify the information contained therein, provided that it is solely for such client’s own use. This Report is not intended to be available or distributed for any purpose that would be deemed unlawful or otherwise prohibited by any local, state, national or international laws or regulations or would otherwise subject the Company to registration or regulation of any kind within such jurisdiction.

Copyrights, Trademarks, Intellectual Property.

22V Research Group, and any logos or marks included in this Report are proprietary materials. The use of such terms and logos and marks without the express written consent of 22V Research Group is strictly prohibited. The copyright in the pages or in the screens of the Report, and in the information and material therein, is proprietary material owned by 22V Research Group unless otherwise indicated. The unauthorized use of any material on this Report may violate numerous statutes, regulations and laws, including, but not limited to, copyright, trademark, trade secret or patent laws.