Many years ago, I visited a PM and after some back-and-forth niceties he said to me, “Tell me something I don’t know.” I looked at the accompanying salesman, turned back to the investor, and said while winking, “Tell me what you know first and then I’ll skip over all of that and concentrate on the good stuff.” All three of us had a friendly chuckle.
There’s no way of knowing what anyone already knows so today’s note, and charts, starts with the idea that you’re depending on me (said without any hubris) to work through what looks to be notable. What follows in “Did You Know?” format is a paean to the eminently quotable George Soros who once said, “I’m not predicting, I’m observing.”
Did you know…
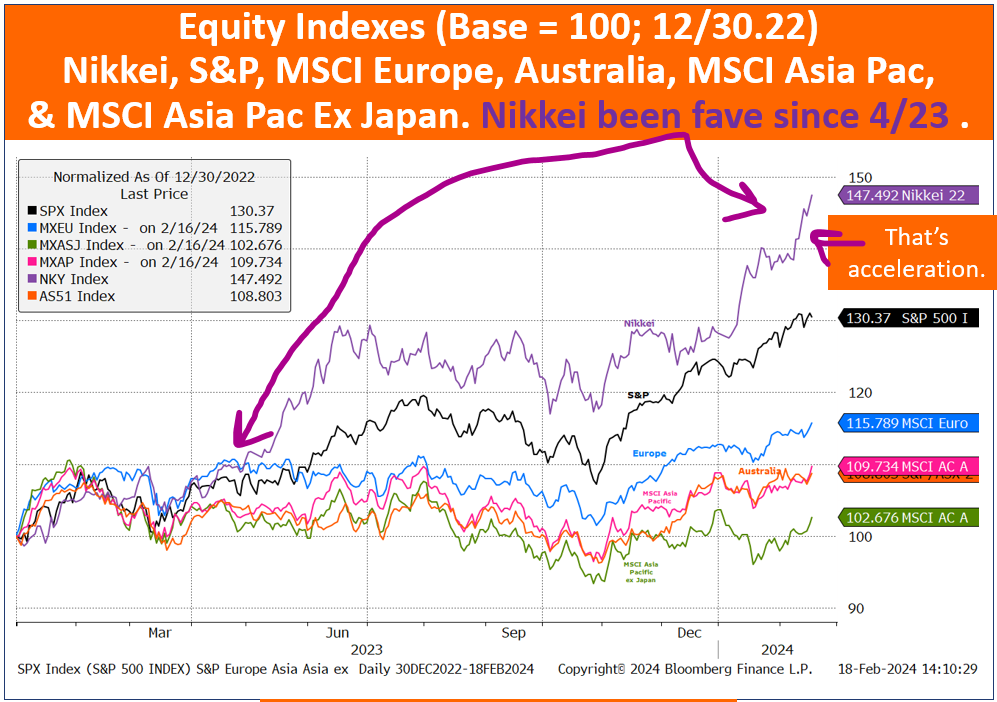
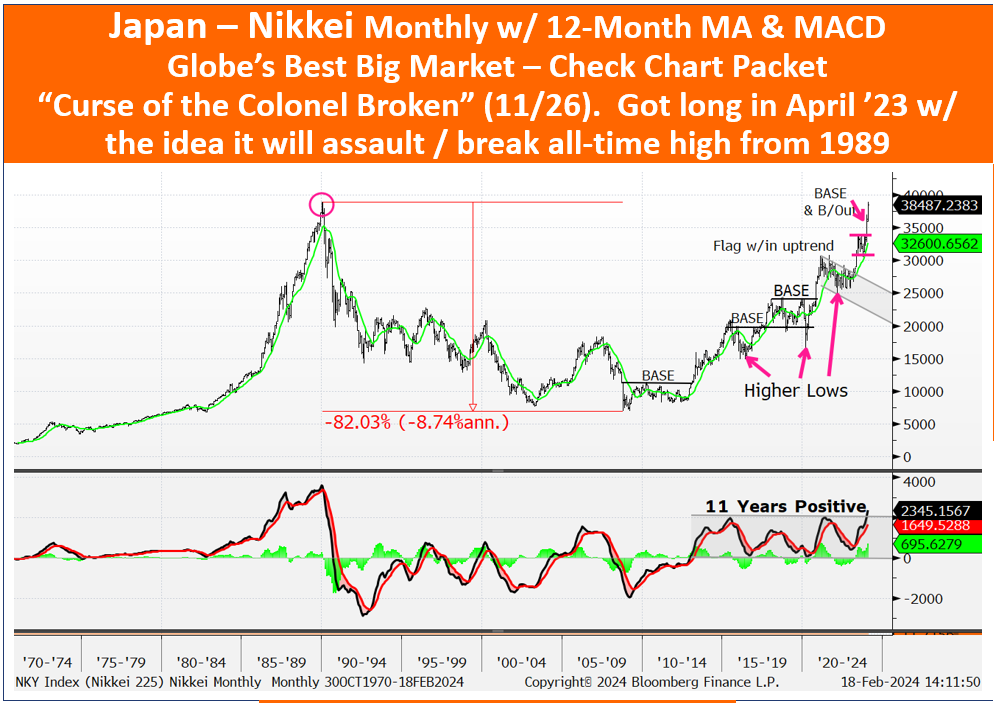
1 that the Nikkei is up 35% since mid-April 2023 and is a mere 1.3% away from its all-time high from 1989-1990?
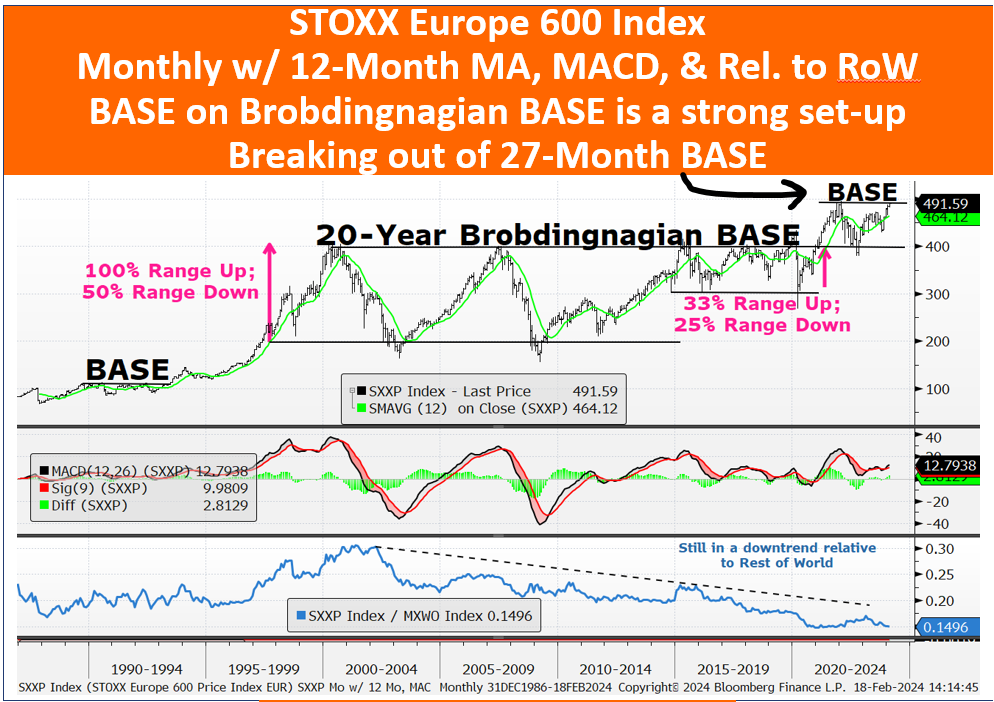
2 that via my Technical Scoring System that Europe is the globe’s strongest region?
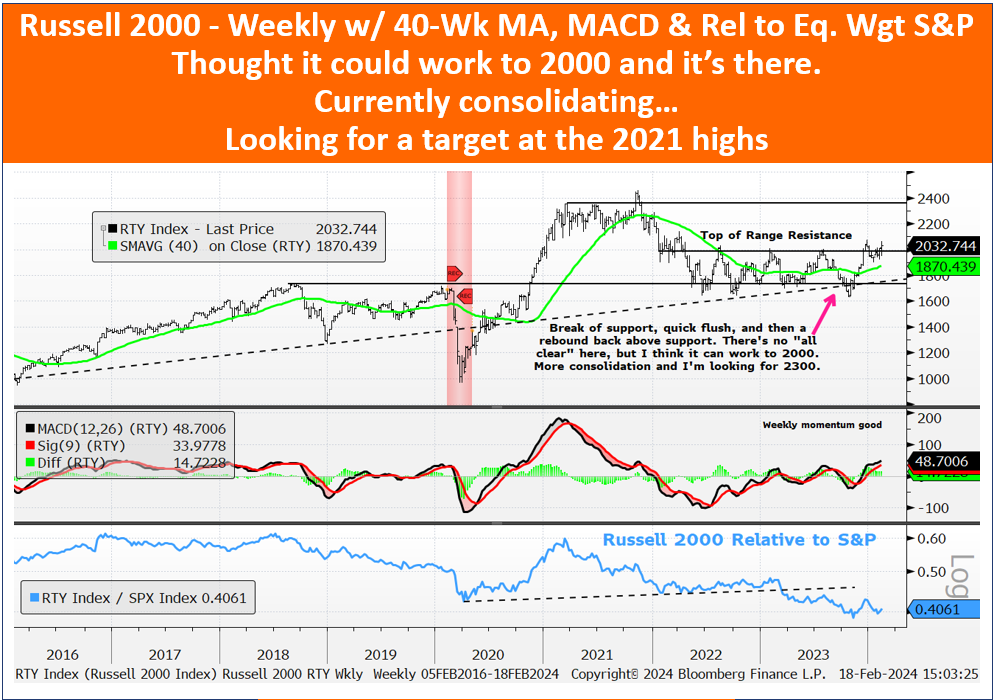
3 that the Russell 2000 / IWM has been up in 3 of the last 4 weeks and is consolidating nicely above its upward-sloping 50, 100, and 200-Day Moving Averages?
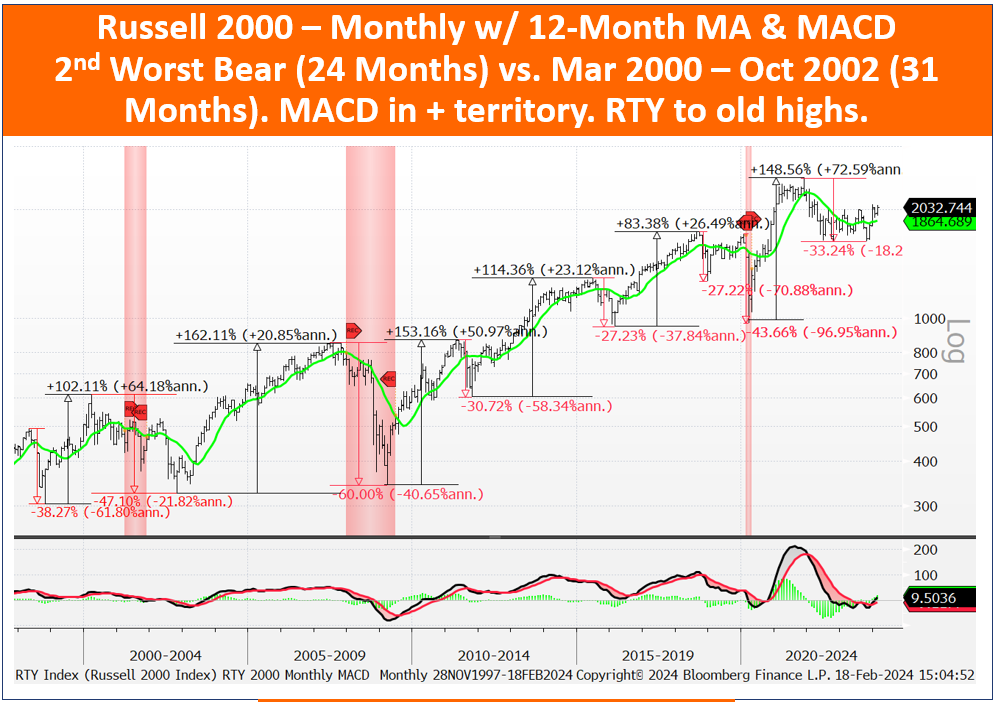
4 that Russell 2000 Bull Markets have produced average gains of 131% with 7 of 11 Bull Markets producing triple-digit gains?
5 that the four non-triple digit Russell 2000 Bulls added at least +75%? The shortest Bull was 10 Months (Aug ’82 – June ’83) while the longest was 89 Months (Nov ’90 – Apr ’98). The average Bull length is 34 months, and the median 25 months.
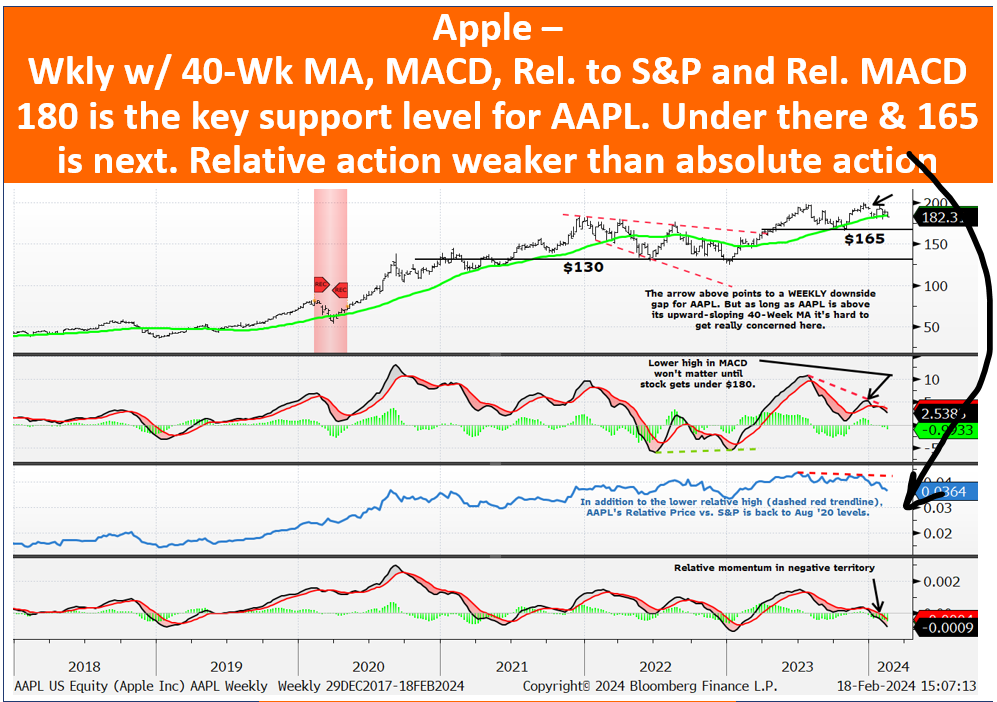
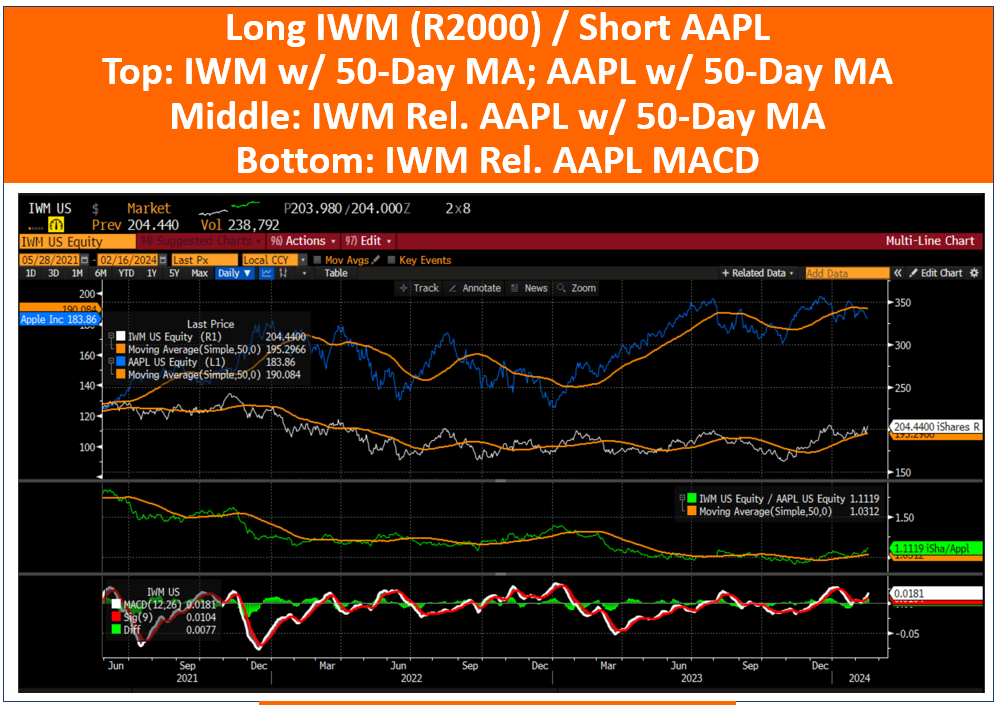
6 relative to the S&P, AAPL is at levels first seen in August 2020? And, I want to be long the IWM vs. AAPL (check chart below).
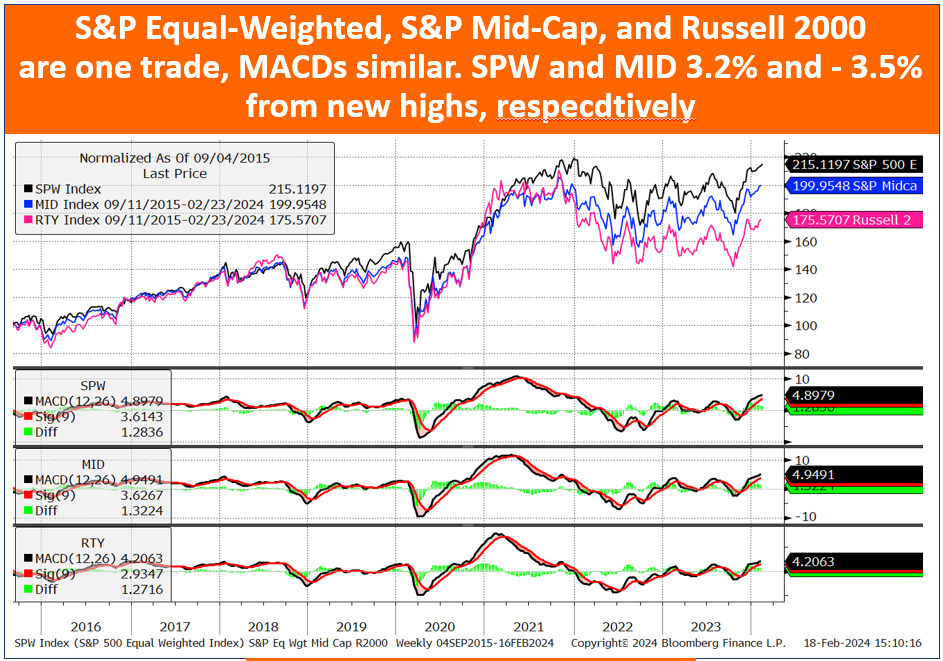
7 the S&P Equal-Weighted and S&P Mid-Cap Indexes are 3.2% and 3.5% away from new all-time highs?
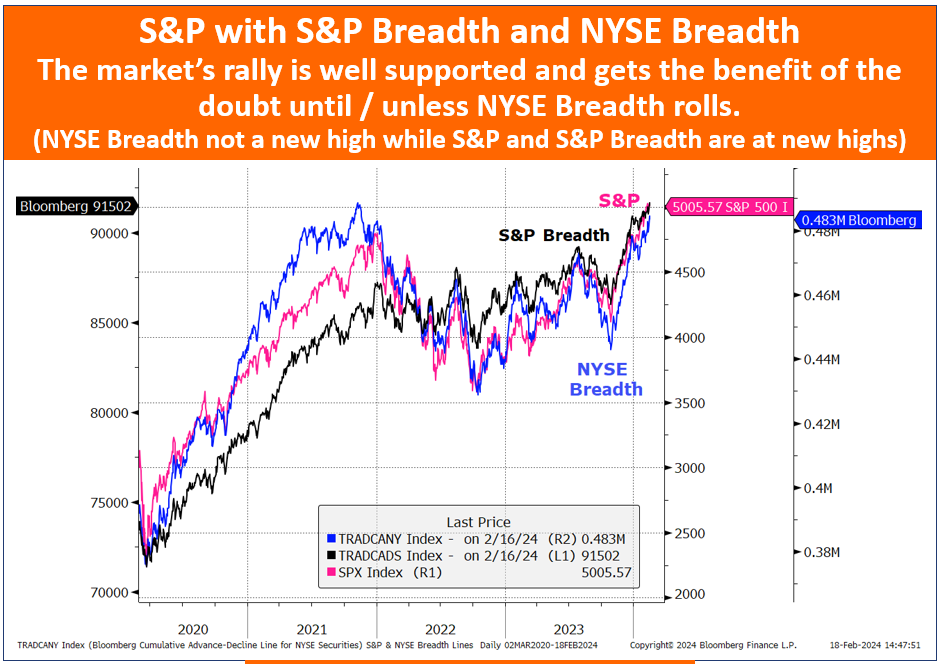
8 while the S&P is overbought across the board (up in 14 of the last 16 weeks), it and the market have been well-supported by strong breadth (i.e., net advancing stocks)?
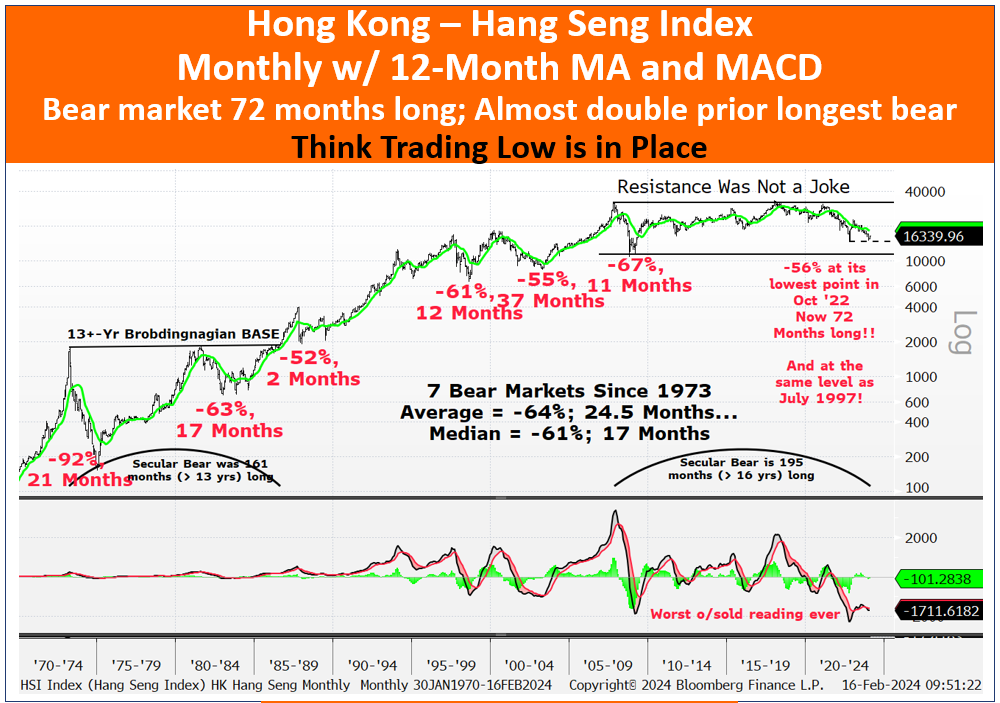
9 it continues to look like Hong Kong / Hang Seng Index has put in a low? If we’re being kind, HK has been in a 72-month bear market and if we’re being critical HK has been in a more than 16-year secular bear market.
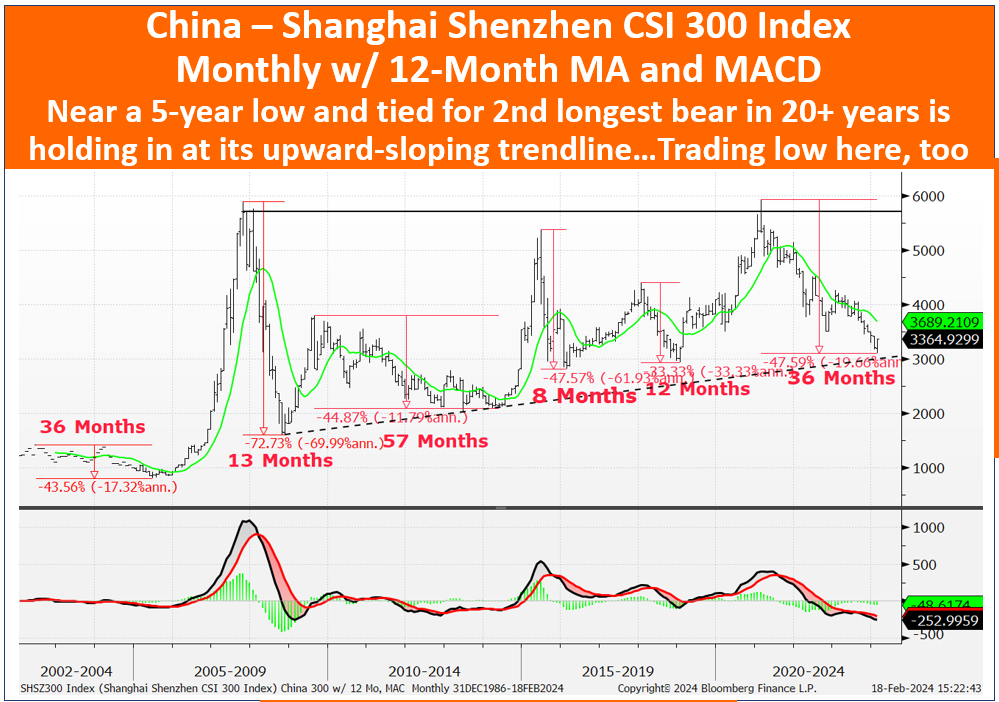
10 it also looks like China / CSI 300 Index has also put in a low?
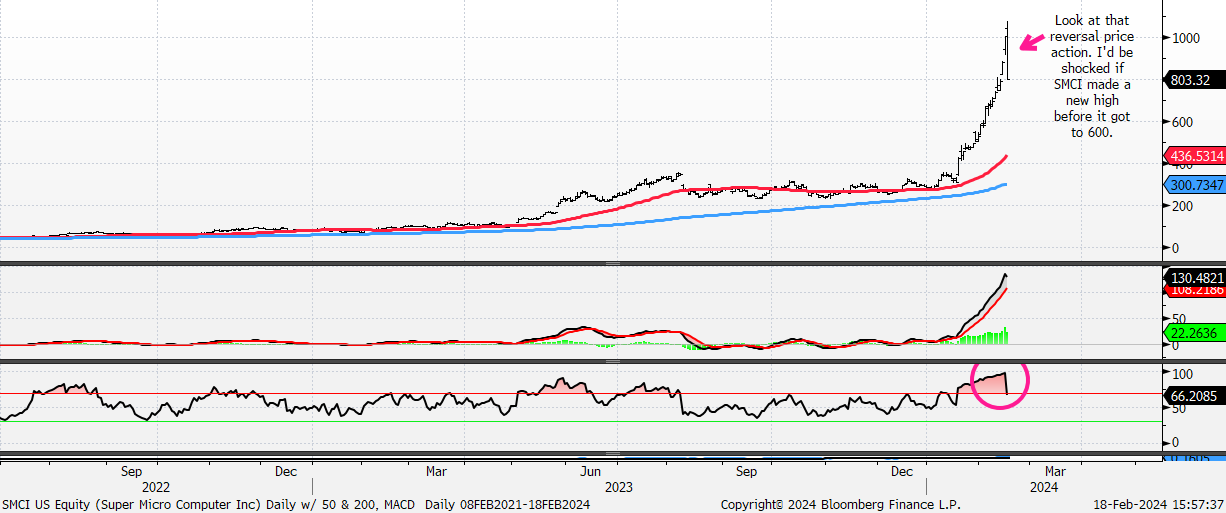
11 on Thursday, Feb 15 Super Micro Computer’s (SMCI) RSI peaked at 96.8 (!) when the stock closed at 1004 and on Friday, Feb 16 SMCI’s RSI was down to 66.2 when the stock closed at 803.32, -20%? I realize that we are in a new era where algos and passive dominate and old rules don’t necessarily apply, but I would be SHOCKED if SMCI made a new high before it corrected to 600 (-25%).
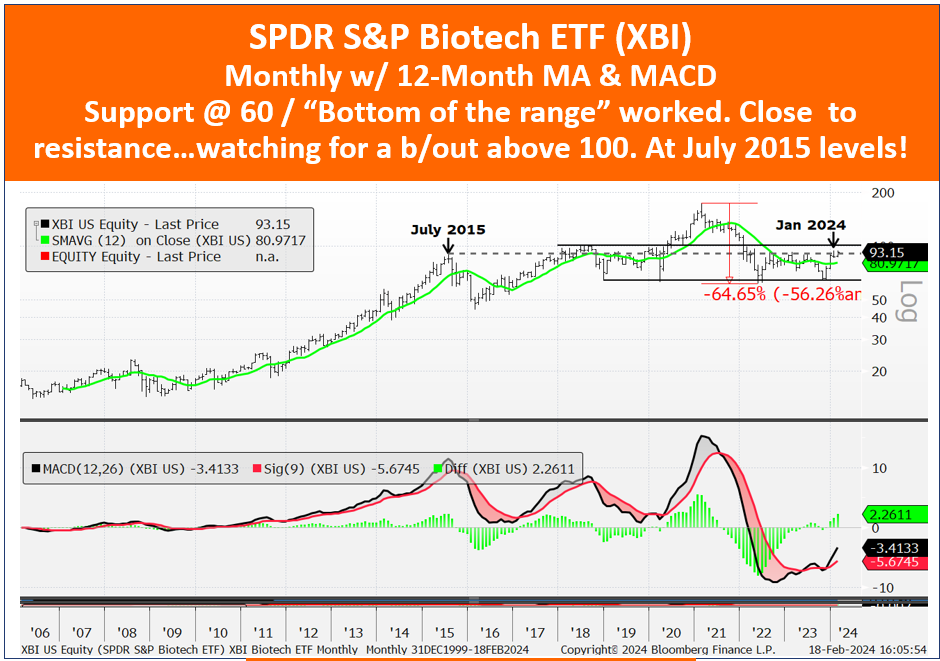
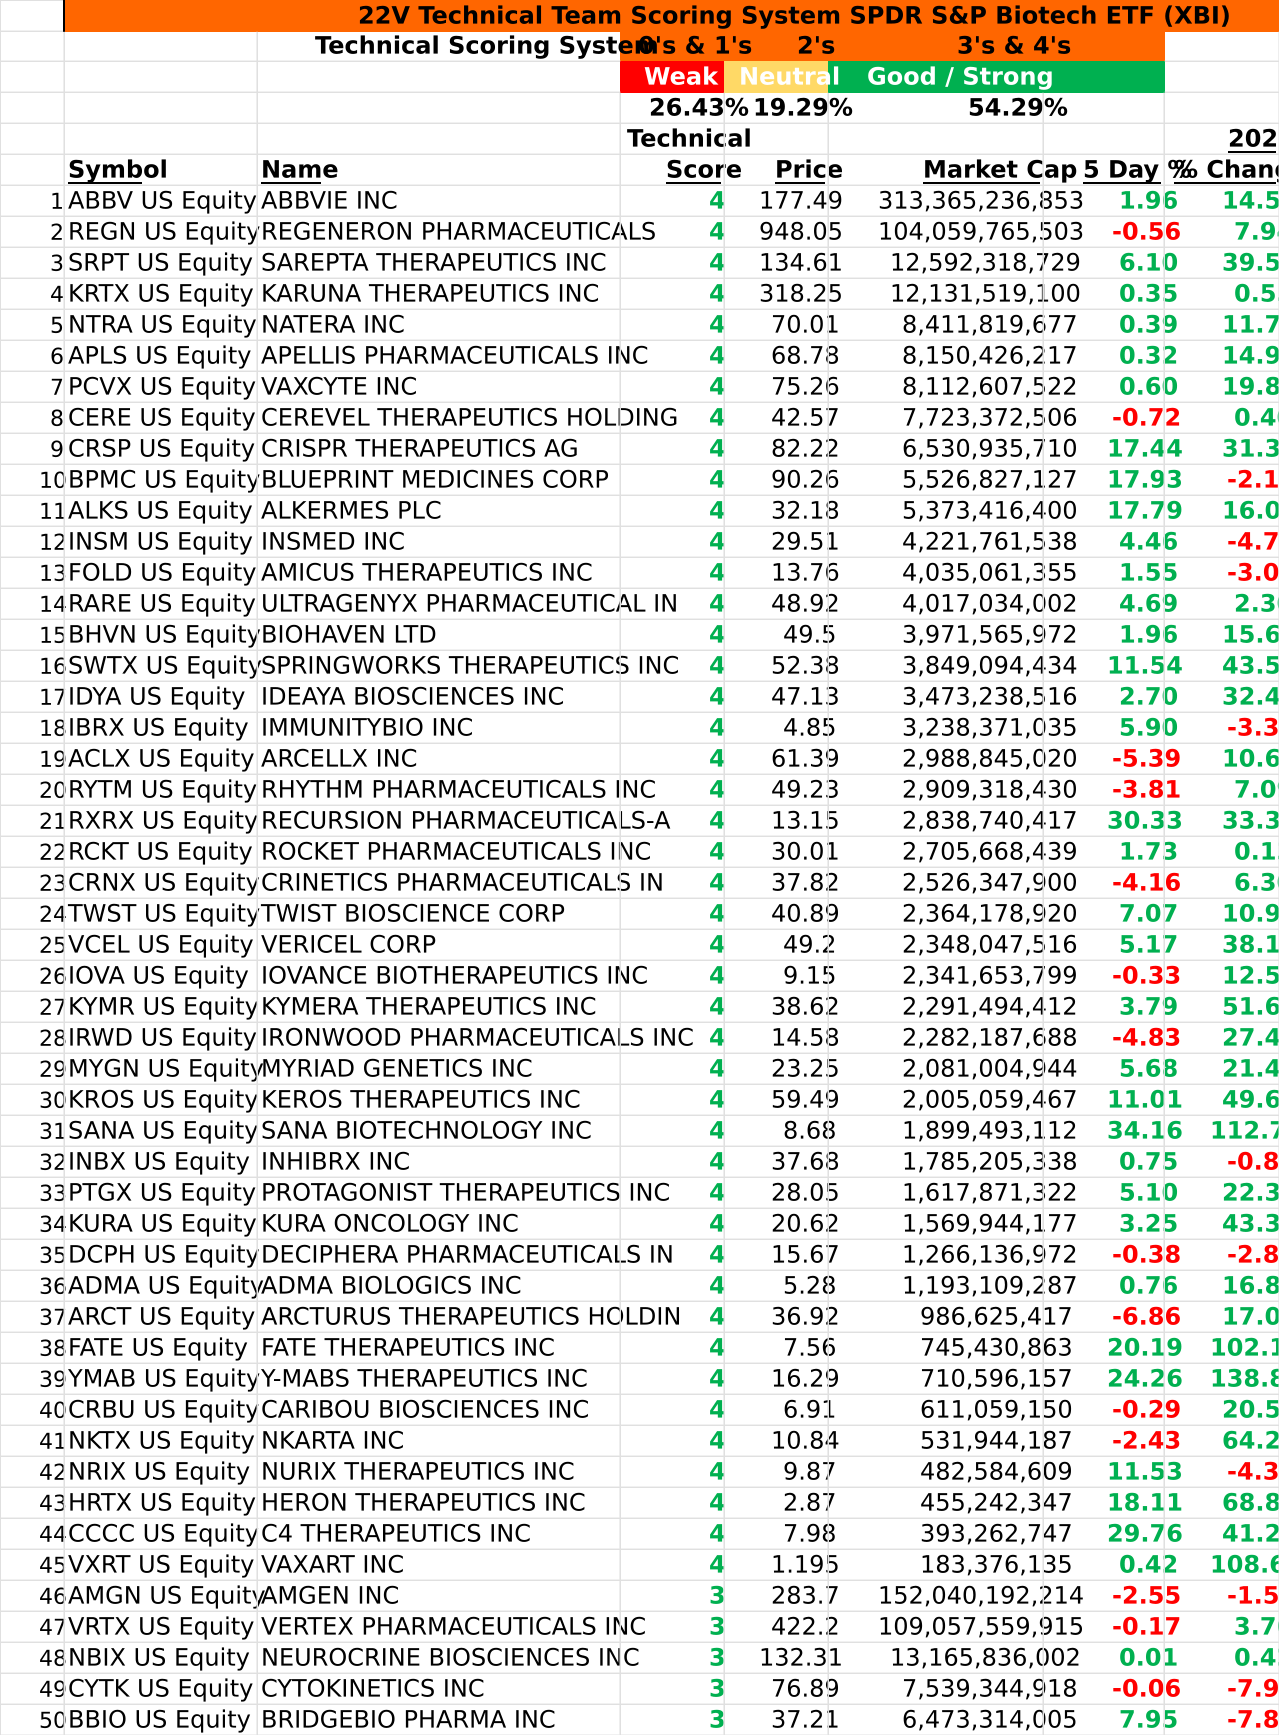
12 the S&P SPDR Biotech ETF (XBI) has been up for two weeks in a row gaining almost 6% and has gained in 10 of the last 12 weeks?
Super Micro Computer – Daily w/ 50- and 200-Day MAs, MACD & RSI