Back Technical Analysis

Willie Wonka Was a Contrarian

Published on February 4, 2024

∙ Download the PDF Report

By

John Roque

It was really Roald Dahl, the author of the 1964 book Charlie and the Chocolate Factory, who was the contrarian, and it was Willie Wonka who gave voice to Dahl’s eccentricities. Anyway, Wonka (Dahl) said – it really is an excellent line and perfectly contrarian – “Oh, you should never, never, doubt what nobody is sure about.” Its direct opposite is equally important and makes perfect paradoxical sense, as did the above, from a contrarian point of view, “Oh, you should ever, ever, doubt what everybody is sure about.” Mind you, Dahl didn’t say the second one, I just turned the first one around.

Applying the Dahl / Wonka line, “Oh, you should never, never, doubt what nobody is sure about” to the market leads me to think that we should, at the very least, consider that the market can continue to accelerate higher such that it reaches excesses that nobody is sure about or that nobody has seen for a very long time because (a) limited history shows it’s happened before, (b) I’ve not heard anyone evangelize about such a notion and (c) as my former partner Steve Shobin used to say, “Momentous momentum begets more momentum.” Let me explain.

Through Friday’s close the S&P has been up for 13 of the last 14 weeks and within those 13 weeks it has had a 9-week winning streak (week ending Nov 3, 2023 – week ending Dec 29, 2023) and then a 4-week winning streak (week ending Jan 12, 2024 – week ending Feb 2, 2024). Using data going back to early January 1960, a period of 3,344 weeks, I found four prior comparable periods where the S&P displayed momentum thrust-like behavior and, in each case, (I realize this is not admissible in stats class, but it might just be important in portfolio management class) the S&P did not put in an important top or experience a sharp correction until much after its initial momentum impulse.

1 From Dec 9, 1960 – Mar 3, 1961, the S&P was up for 12 of 13 weeks where it added 13%. The S&P stayed strong into December 1961 adding another 13% from early March 1961 until the end of the year.

2 From Mar 8, 1963 – May 10, 1963, the S&P rose for 10 weeks in a row gaining 9%. The S&P then continued to push higher, adding 25% in the process, until May 1965 when it had a one-month correction of 10%. Post the correction the S&P added another 15% into February 1966 when a bear market started (-22% through Oct 1966).

3 From Oct 4, 1985 – Jan 3, 1986, the S&P was up for 13 of 14 weeks where it jumped 15%. The S&P added another 17% into the end of 1986 and then, without too much of a breather, the index smoked higher by 36% (!) from late 1986 and into the third week in August 1987. August 1987 was the market’s peak and was followed by the “Crash of 1987” in October.

4 From Nov 28, 2003 – Mar 5, 2004, the S&P gained in 13 of 15 weeks where it tacked on 9%. The S&P only added another 5% from Mar 5 through the end of December 2004. It BASED in 2005 and then pushed higher by 22 ½% from November 2005 (with an 8% spring 2006 setback) until summer 2007 which was where the market peaked before anyone had an inkling about the oncoming GFC.

It’s true the S&P is daily and weekly overbought (I’ll say monthly, too) and it is 11% above its 40-Week Moving Average which is more than a +1 Standard Deviation reading for the S&P vs. its 40-Week MA for data back to early Jan 1960 (3,344 weeks). But what’s to stop it from getting to a +2 Standard Deviation reading (+18%) above its 40-Week MA? And, what’s to stop overbought stocks from getting more overbought a la Super Micro Computer (SMCI; on Friday morning it was 127% above its 200-Day MA) or Meta (META) which added almost $200B in market cap on Friday alone?! (META’s additional market cap is > 467 or 93% of the companies in the S&P 500).
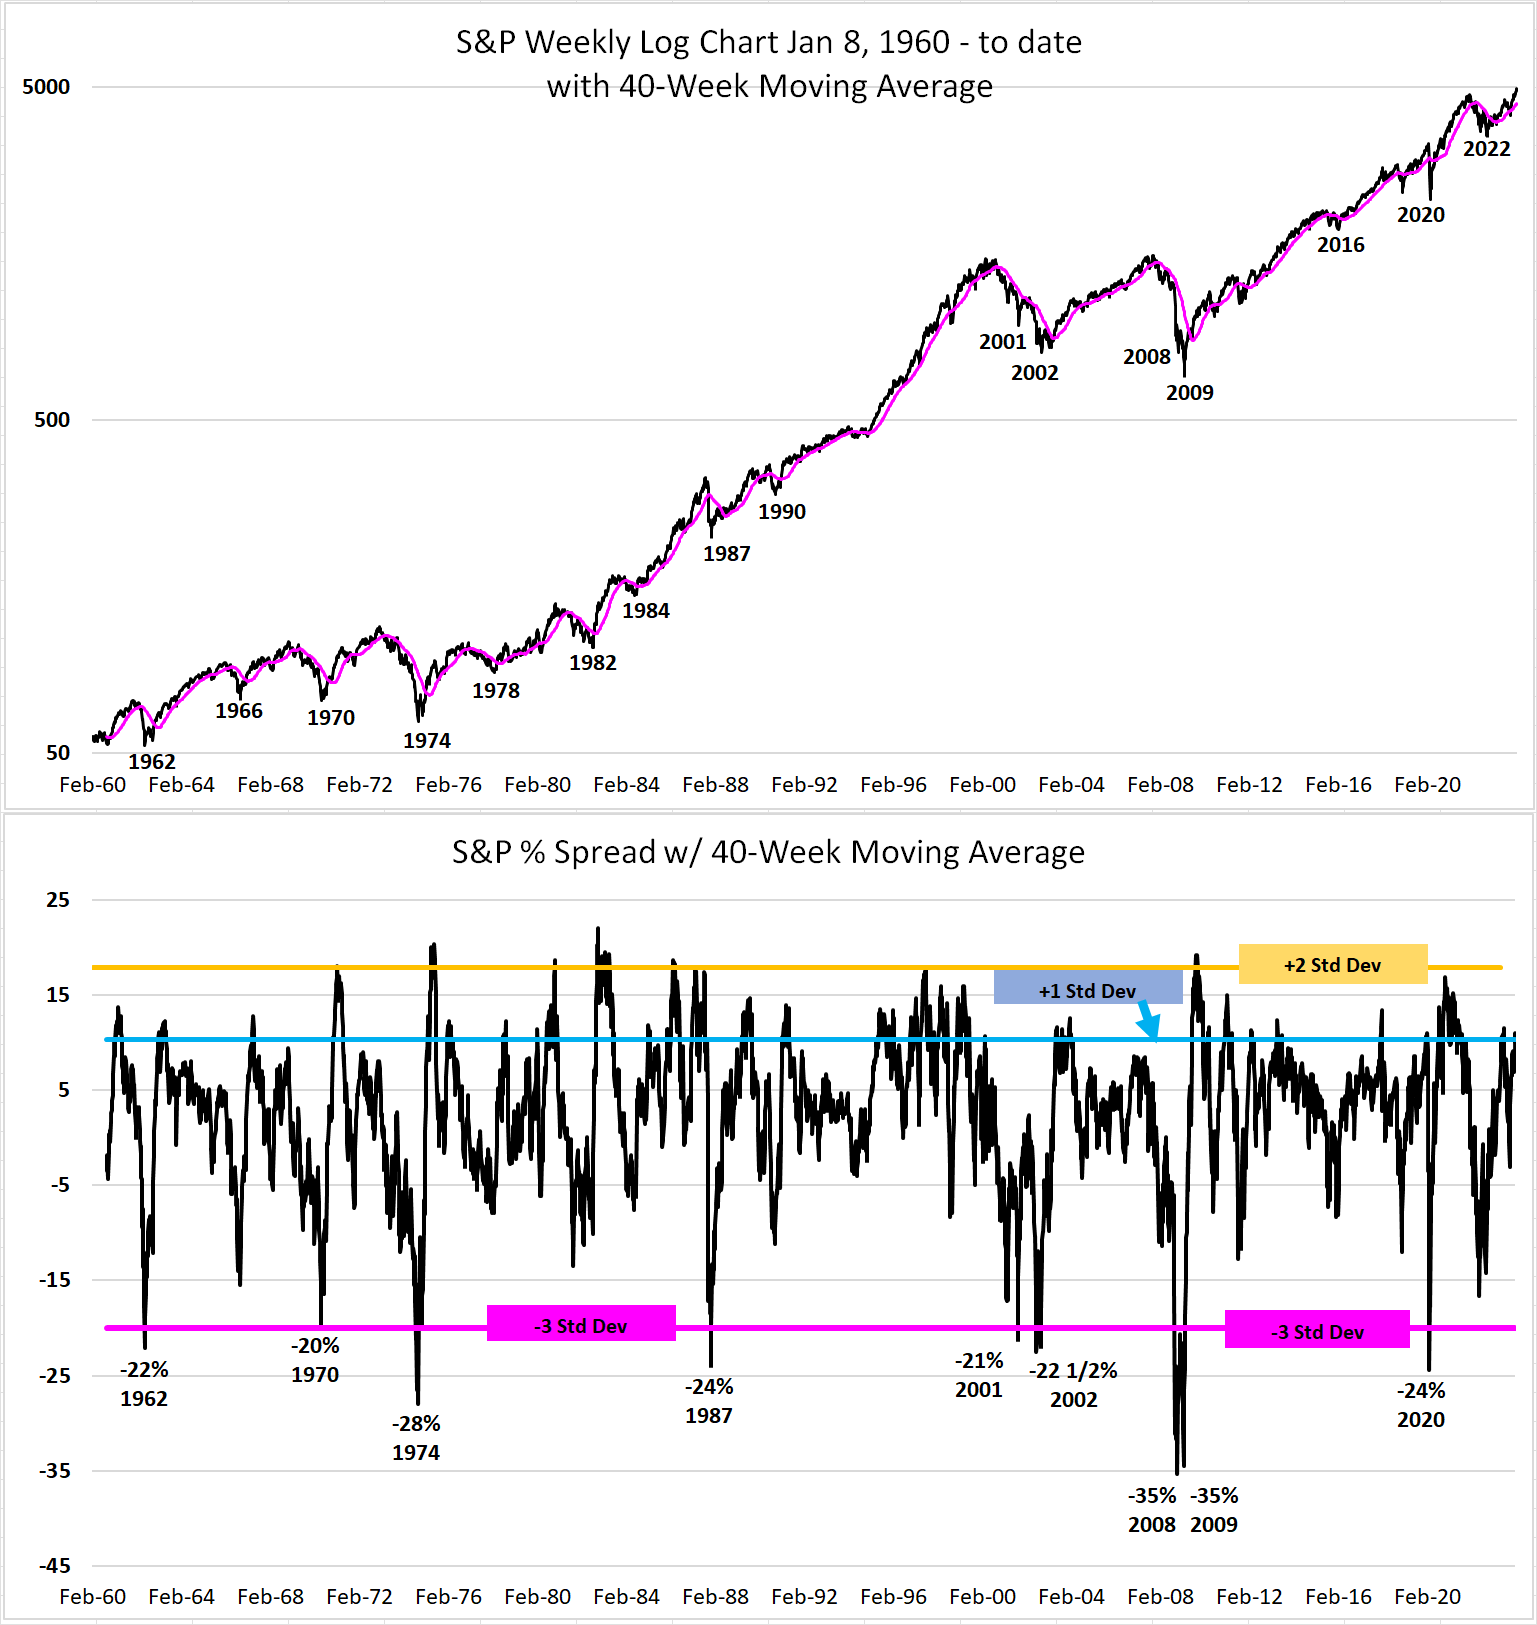
A screenshot of a graph

Description automatically generated
Source: 22V Research

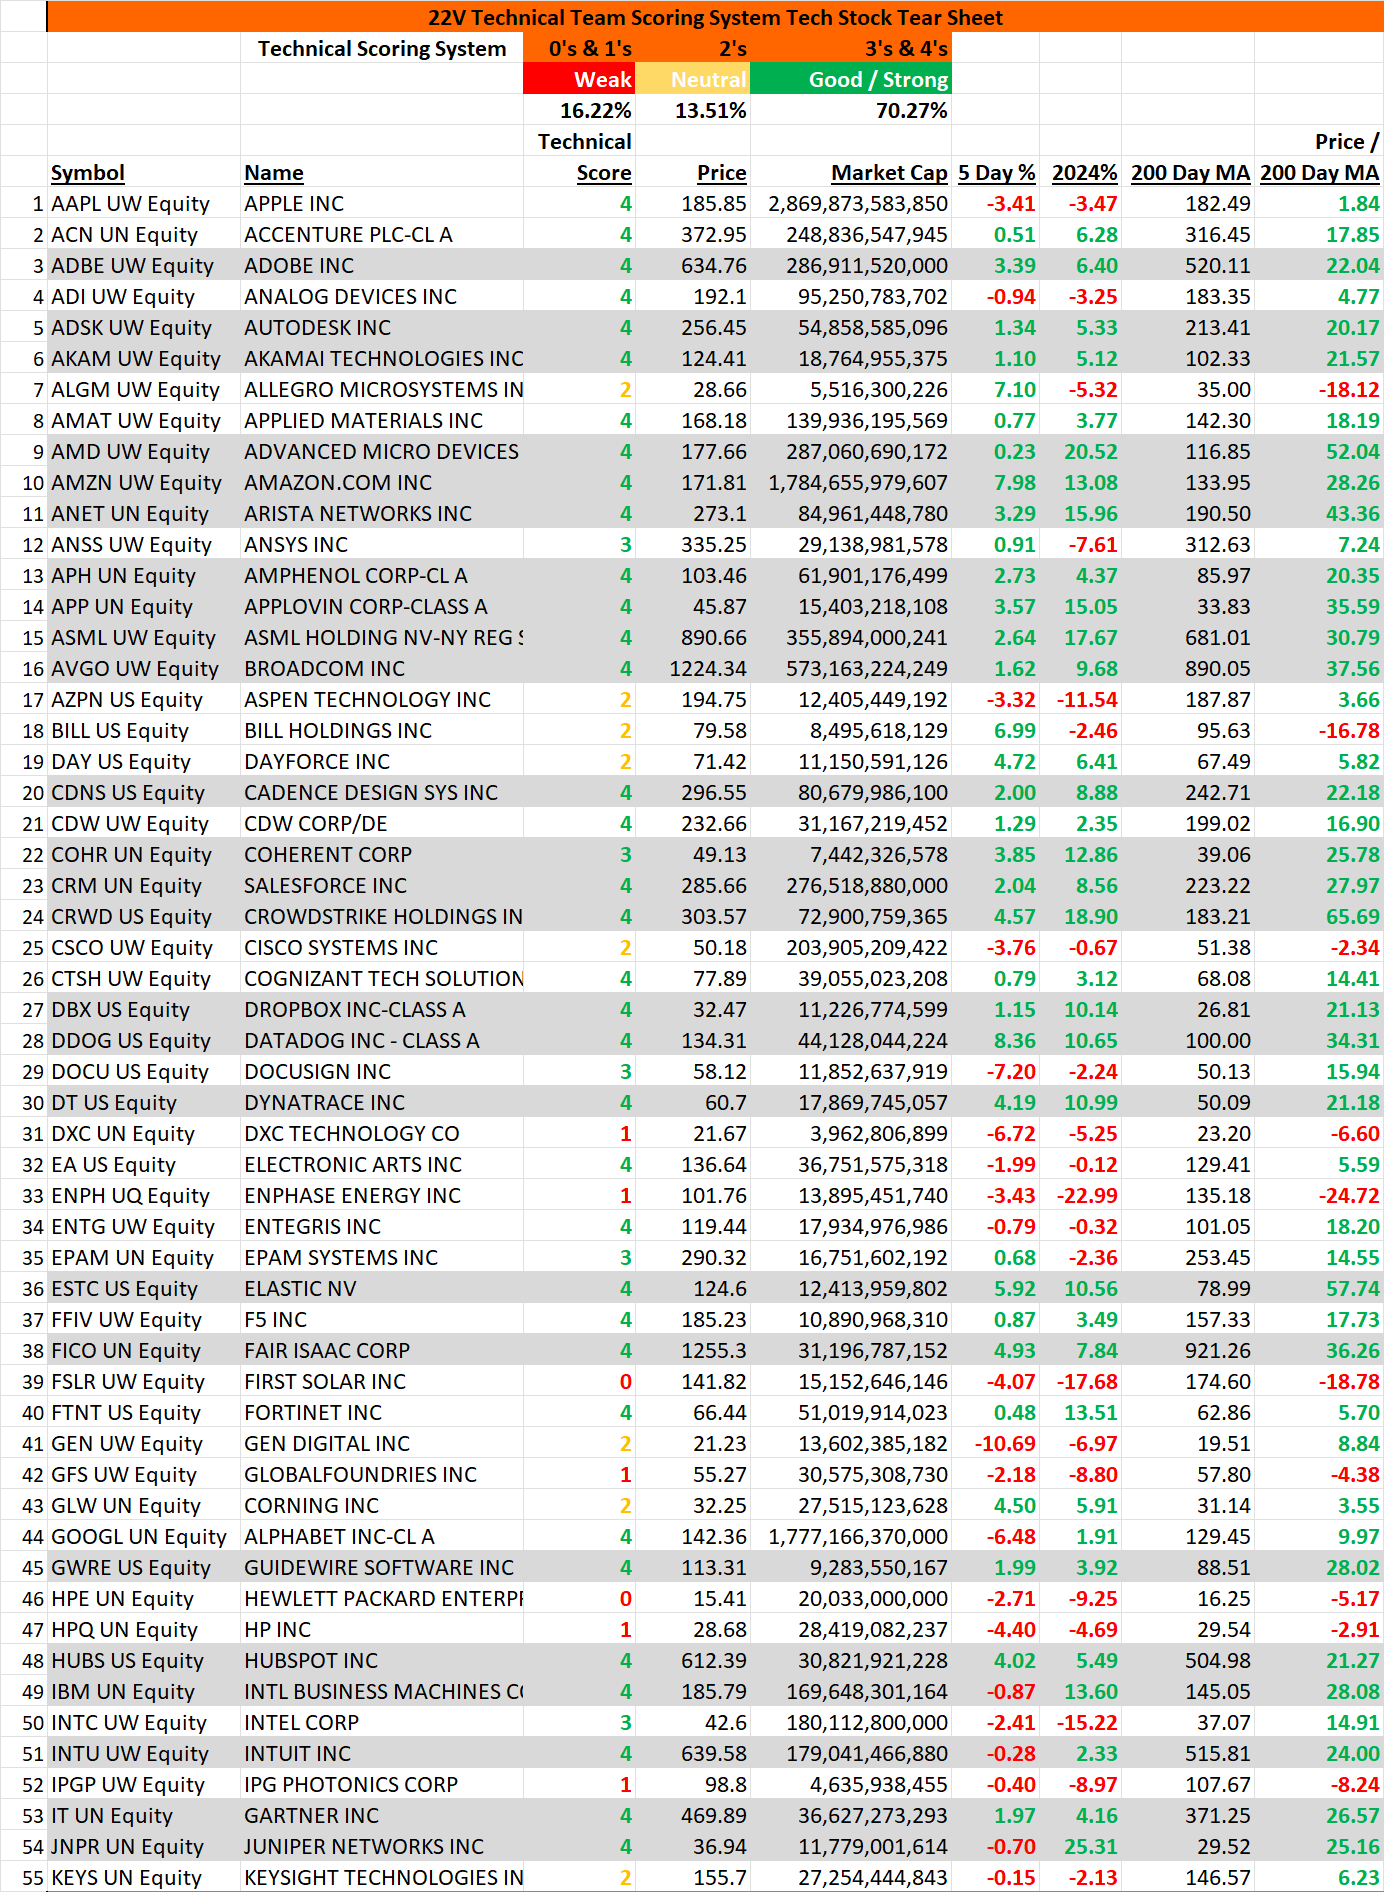
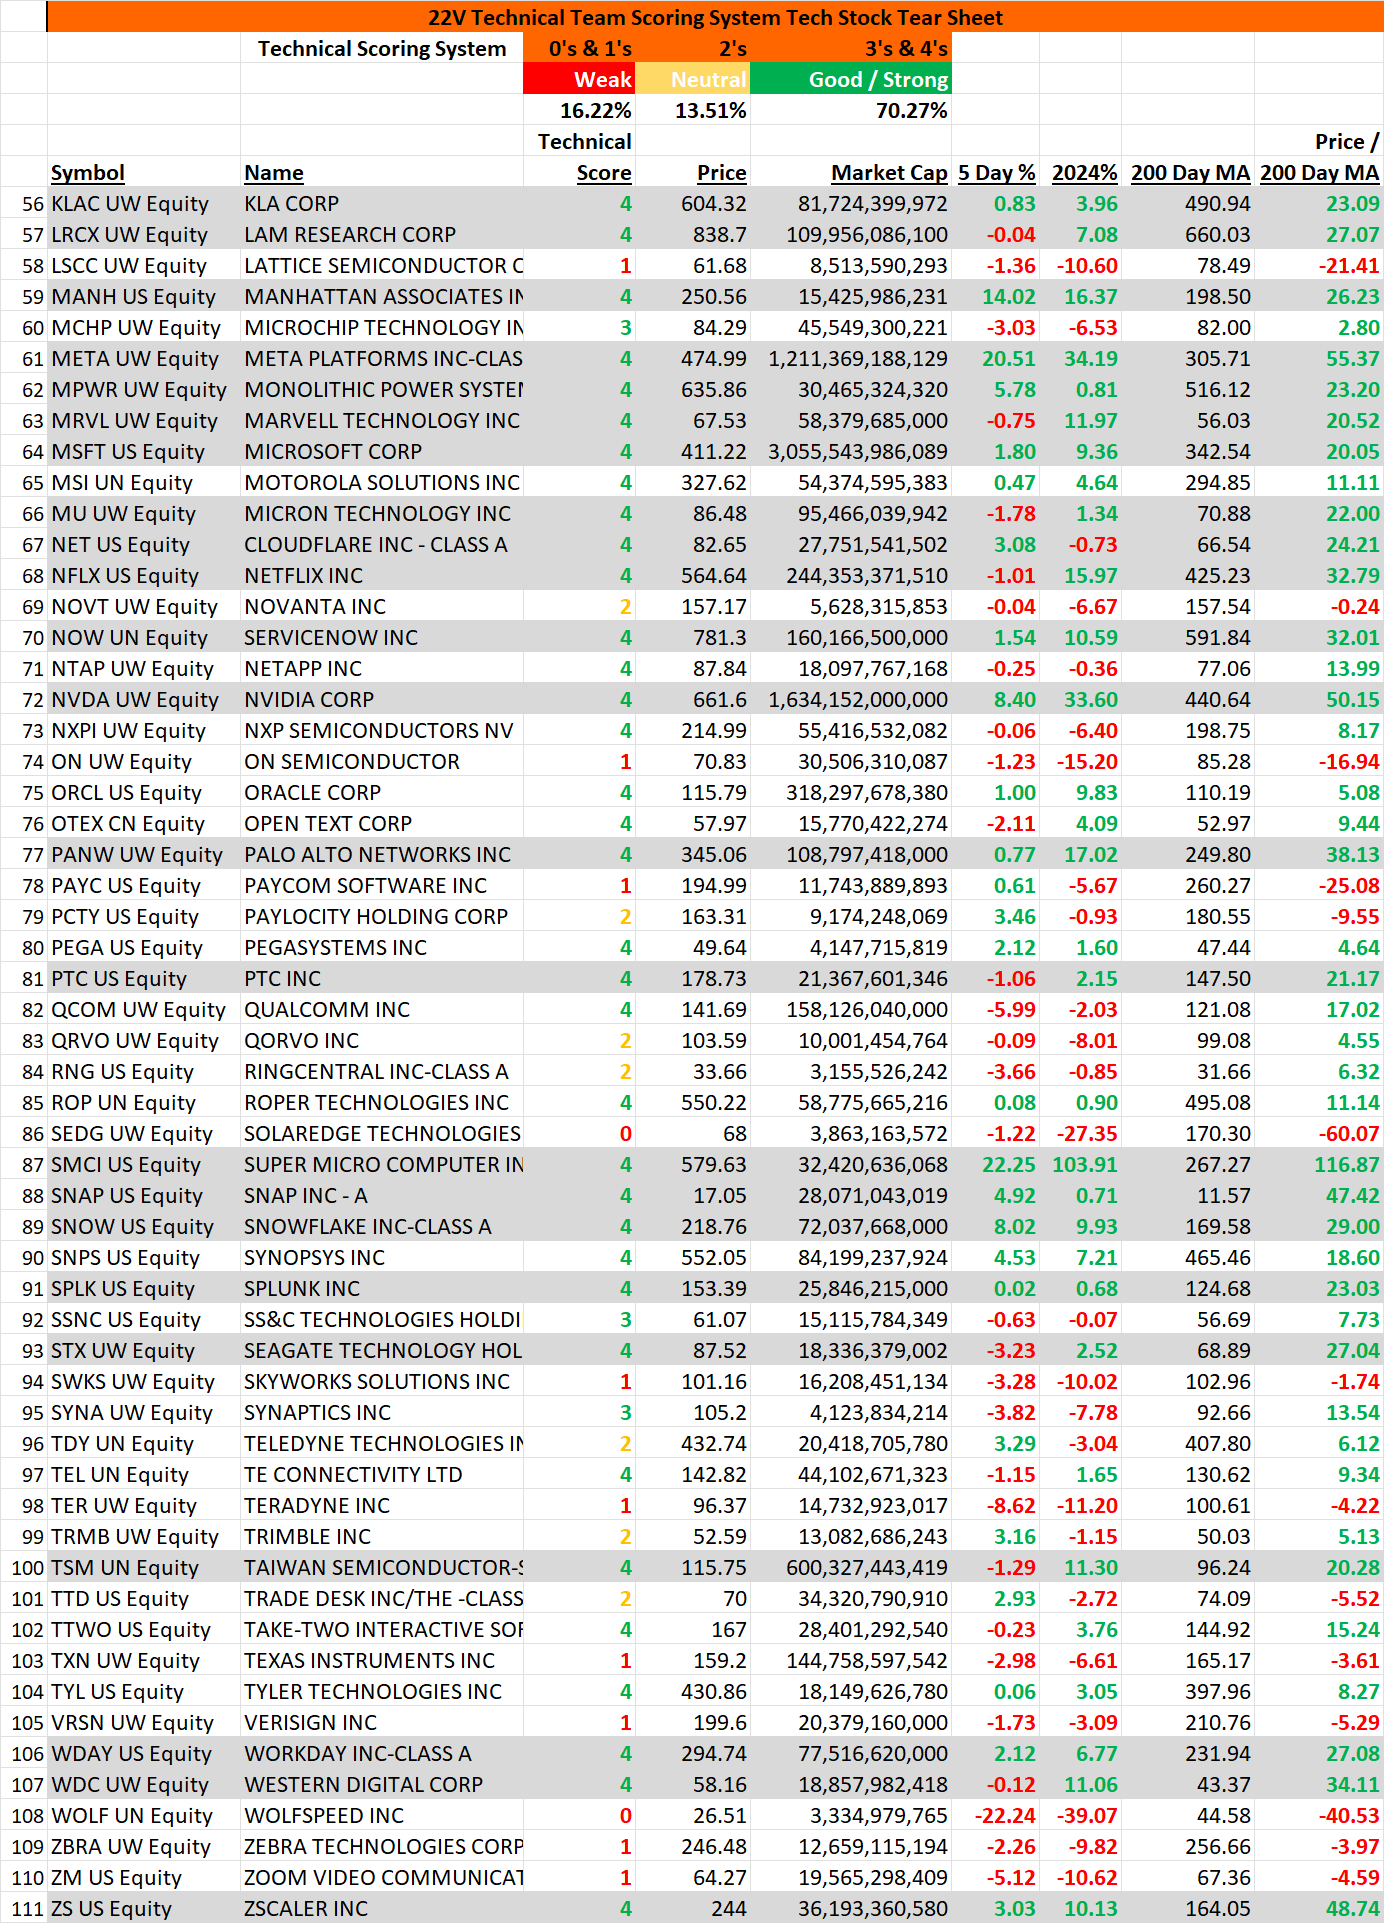
Below you’ll find a list of 109 Tech Stocks, and I’m especially interested in the 48, or 44%, that are at least 20% above their 200-Day Moving Averages (gray tint). I’m interested in these stocks because it appears to me that we just might be in the part of the cycle where excessively overbought becomes unrestrainedly overbought. The most notorious examples – mentioned in the above paragraph are Super Micro Computer (SMCI) and Meta (META). In a note to clients on January 21, 2024, entitled, “How to Marry a Millionaire” I said with respect to SMCI, and tongue-in-cheek, “What’s the message here? If you see a tech stock with excessive momentum overbought readings, buy it.”

While this might be imprudent (heck, it seems pretty imprudent to me), I’m thinking the stocks highlighted in gray that are at least 20% above their 200-Day MA become even more stretched relative to their 200-Day MAs. How will we know when this parlor game becomes a “Party Out of Bounds” (B-52s 1980)? When one of these stocks fails, that’s how.
A screenshot of a computer screen

Description automatically generated
Source: 22V Research
A screen shot of a chart

Description automatically generated
Source: 22V Research

Let me know if you want to talk about any of the stocks in the list above. As to other items:

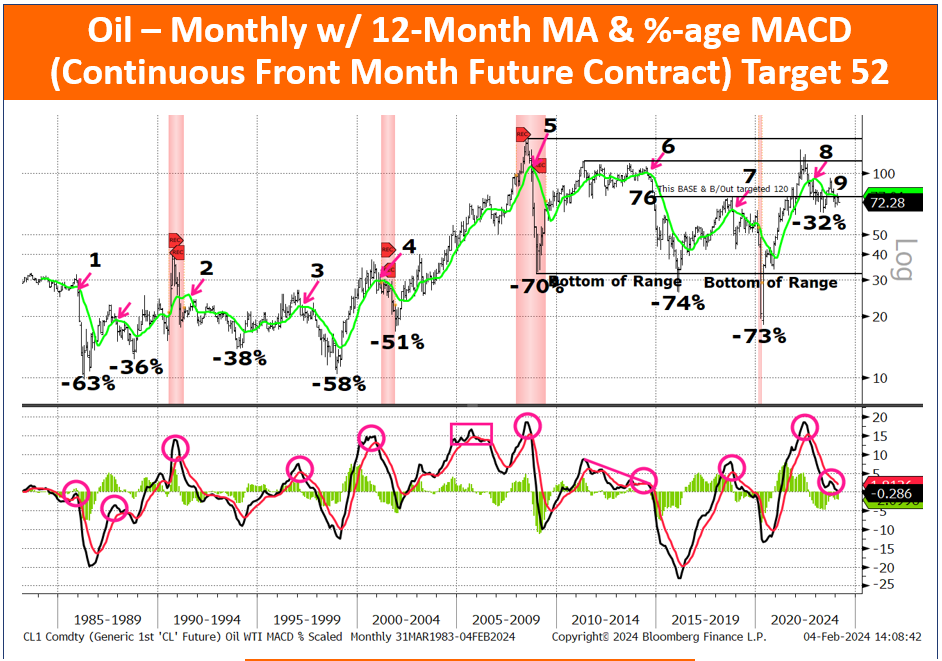
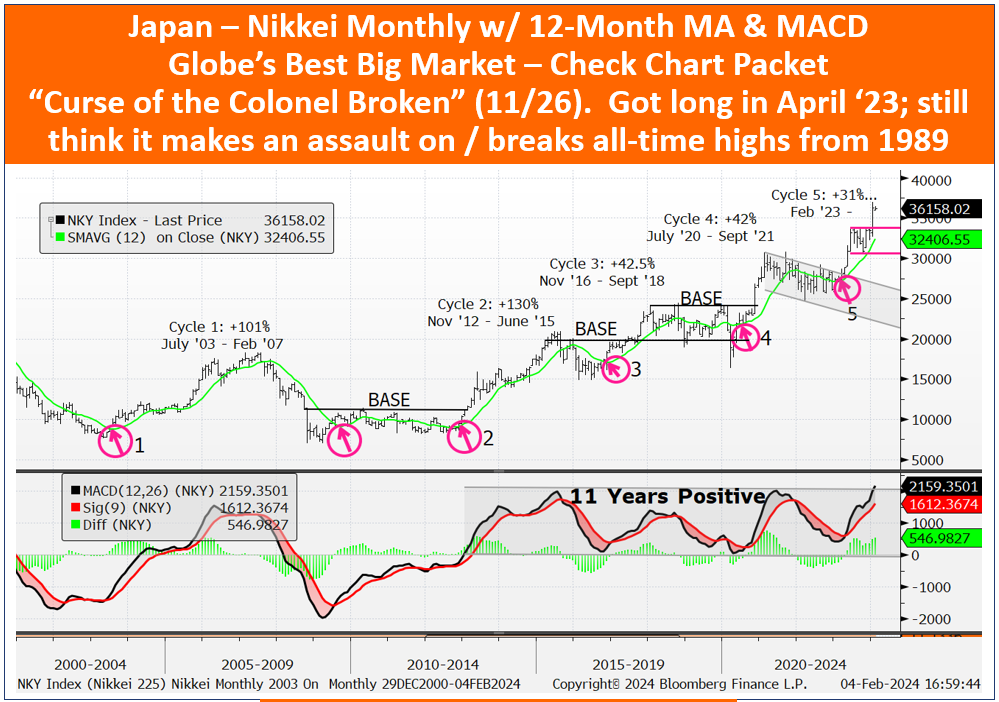
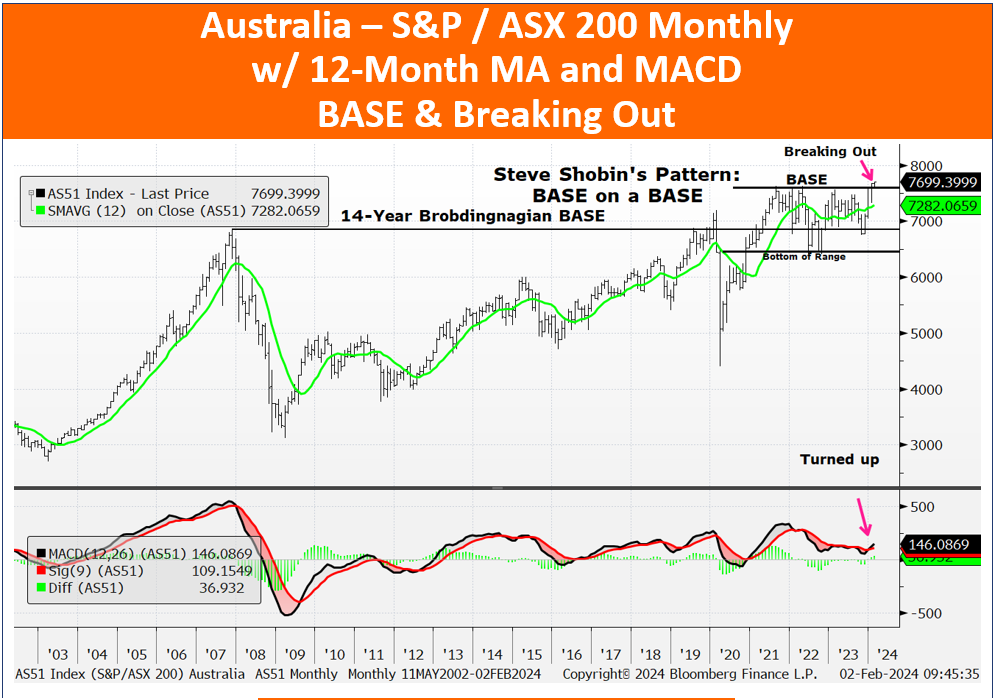
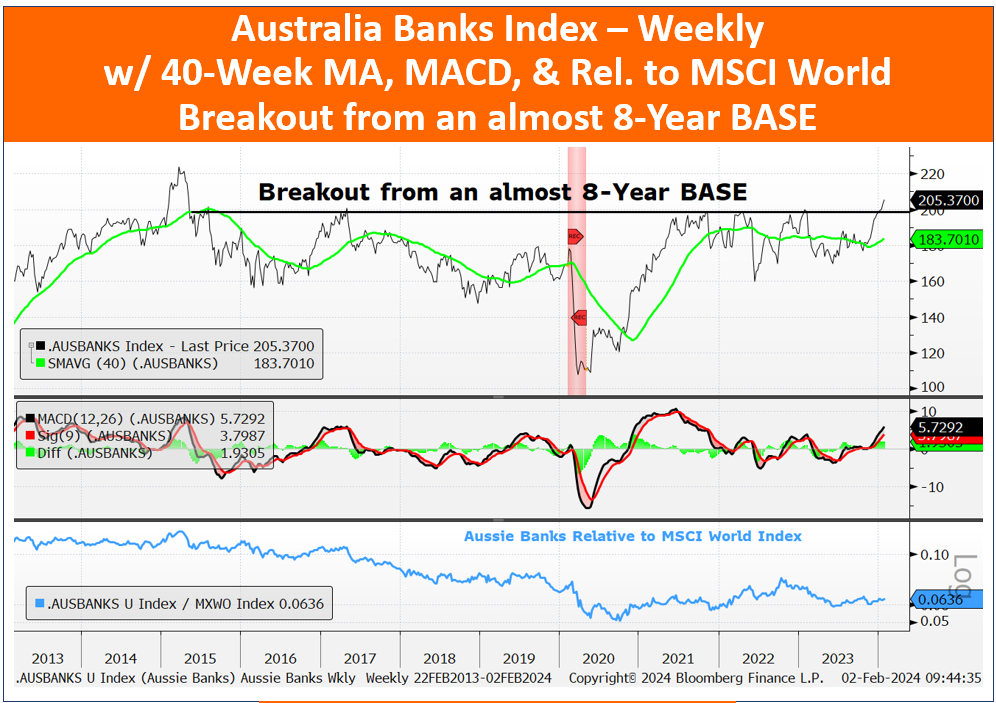
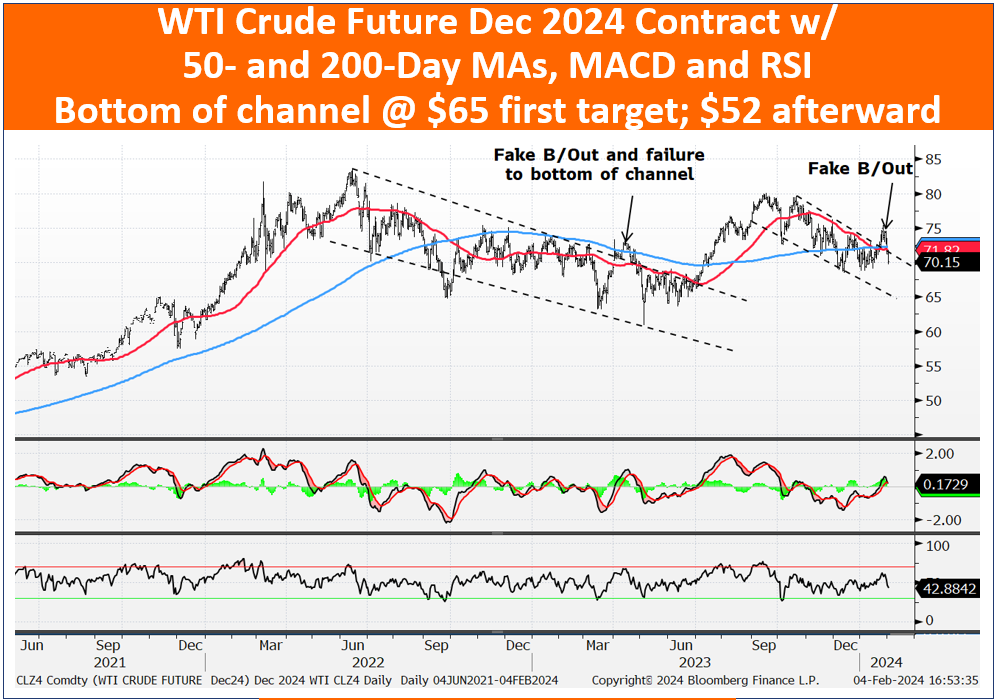
I continue to think oil works lower.
A graph of stock market

Description automatically generated
A graph with numbers and lines

Description automatically generated
A graph of stock market trends

Description automatically generated with medium confidence
A graph of stock market

Description automatically generated
A black numbers on a white background

Description automatically generated
A graph with numbers and lines

Description automatically generated
A graph with red green and blue lines

Description automatically generated
A graph of stock market

Description automatically generated with medium confidence
A person wearing goggles on a television screen

Description automatically generated
A person standing in front of a television screen

Description automatically generated

DISCLOSURES AND DISCLAIMERS

Analyst Certification

The analyst, 22V Research Group, primarily responsible for the preparation of this research report attests to the following: (1) that the views and opinions rendered in this research report reflect his or her personal views about the subject companies or issuers; and (2) that no part of the research analyst’s compensation was, is, or will be directly related to the specific recommendations or views in this research report.

Analyst Certifications and Independence of Research.

Each of the 22V Research analysts whose names appear on the front page of this report hereby certify that all the views expressed in this Report accurately reflect our personal views about any and all of the subject securities or issuers and that no part of our compensation was, is, or will be, directly or indirectly, related to the specific recommendations or views of in this Report.

22V Research (the “Company”) is an independent research provider. The Company is not a member of the FINRA or the SIPC and is not a registered broker dealer or investment adviser. 22V Research has no other regulated or unregulated business activities which conflict with its provision of independent research.

22V Research, LLC is a professional services and independent publication organization. 22V Research, LLC is not a securities broker-dealer, not a member of the Financial Industry Regulatory Authority (FINRA), not a registered investment advisor (RIA) and not a member of SIPC.

Securities transactions, when offered, are offered by 22V Securities, LLC through LPS Capital, LLC. Certain employees of 22V Securities, LLC are dually registered as securities representatives of LPS Capital, LLC or Analyst Hub Securities, LLC. 22V Securities, LPS Capital and Analyst Hub Securities are members FINRA, SIPC.

https://brokercheck.finra.org/

Current Ratings Definition.

SECTOR OUTPERFORM: An “outperform” rating anticipates the company will outperform the S&P Regional Banking Index (peer group).

SECTOR PERFORM: A “market perform” rating anticipates the company will perform in line with the S&P Regional Banking Index (peer group).

SECTOR UNDERPERFORM: An “underperform” rating anticipates the company will underperform the S&P Regional Banking Index (peer group).

Limitation Of Research And Information.

This Report has been prepared for distribution to only qualified institutional or professional clients of 22V Research Group. The contents of this Report represent the views, opinions, and analyses of its authors. The information contained herein does not constitute financial, legal, tax or any other advice. All third-party data presented herein were obtained from publicly available sources which are believed to be reliable; however, the Company makes no warranty, express or implied, concerning the accuracy or completeness of such information. In no event shall the Company be responsible or liable for the correctness of, or update to, any such material or for any damage or lost opportunities resulting from use of this data. Nothing contained in this Report or any distribution by the Company should be construed as any offer to sell, or any solicitation of an offer to buy, any security or investment. Any research or other material received should not be construed as individualized investment advice. Investment decisions should be made as part of an overall portfolio strategy and you should consult with a professional financial advisor, legal and tax advisor prior to making any investment decision. 22V Research Group shall not be liable for any direct or indirect, incidental or consequential loss or damage (including loss of profits, revenue or goodwill) arising from any investment decisions based on information or research obtained from 22V Research Group.

Reproduction And Distribution Strictly Prohibited.

No user of this Report may reproduce, modify, copy, distribute, sell, resell, transmit, transfer, license, assign or publish the Report itself or any information contained therein. Notwithstanding the foregoing, clients with access to working models are permitted to alter or modify the information contained therein, provided that it is solely for such client’s own use. This Report is not intended to be available or distributed for any purpose that would be deemed unlawful or otherwise prohibited by any local, state, national or international laws or regulations or would otherwise subject the Company to registration or regulation of any kind within such jurisdiction.

Copyrights, Trademarks, Intellectual Property.

22V Research Group, and any logos or marks included in this Report are proprietary materials. The use of such terms and logos and marks without the express written consent of 22V Research Group is strictly prohibited. The copyright in the pages or in the screens of the Report, and in the information and material therein, is proprietary material owned by 22V Research Group unless otherwise indicated. The unauthorized use of any material on this Report may violate numerous statutes, regulations and laws, including, but not limited to, copyright, trademark, trade secret or patent laws.