Please forgive me for not being fast enough to remember that the 36-year anniversary of “Send it in, Jerome” was on January 25th. As a result, this is a belated homage and, of course, market analogy.
Sports fans, in general, and sports fans of a certain age, in particular, will remember that something uniquely famous in college hoops happened on January 25, 1988, in a “Big Monday” Big East game (when all conferences were regionally based) between the visiting Providence College Friars and the home team, ranked 11th at the time, University of Pittsburgh Panthers. The point guard for Pitt, Sean Miller, picked up a loose ball near the Friars’ basket and started a 3 on 1 fast break with Pitt’s power forward, Jerome Lane, filling the lane (no pun intended) on his right. Miller delivers a pass to Lane as Lane steps inside the three-point arc, Lane takes his two allotted steps, and with the ball palmed in his right hand dunks the basketball so ferociously that he tore the rim from its moorings and shattered the backboard. The crowd erupted and Bill Raftery, doing color commentary for ESPN, let loose with his own distinct and eccentrically famous exclamation, “Send it in, Jerome.”
Bill Raftery won’t make such an exclamation this time (it’d be funny if Cramer does the honors on CNBC), but investors believe Federal Reserve Chairman Jerome Powell will “send it in” this week and confirm expectations that the Fed will cut rates three times in 2024. With all US Yields below the Fed Funds rate, it would seem natural that Jerome Powell will follow Jerome Lane’s lead, regardless that 1lb. of bananas at Country Markets in Eastchester is now going for 99 cents, the highest price for bananas I’ve ever seen!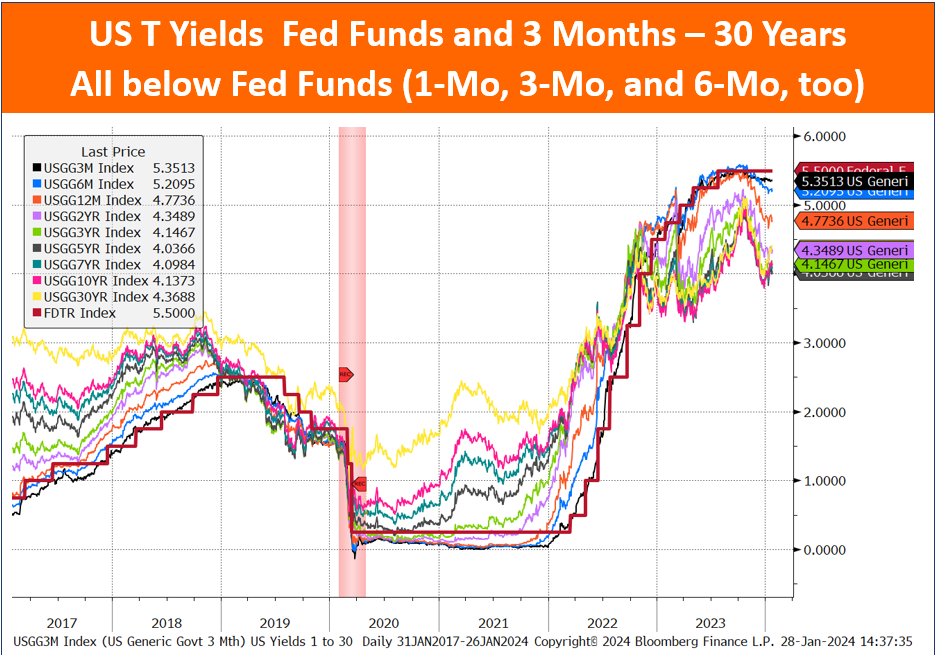
I’ve contended for a long time that the greatest repository of investor sentiment extant is displayed daily via Bloomberg and CNBC. When asked, “What are investors saying?” by other investors I reply with what I’ve learned anecdotally and then I offer my opinion about sentiment being out in the open on Bloomberg and CNBC for all to see. 9 out of 10 institutional investors then reply with, “I don’t watch CNBC.” And while this might be true, these same types of investors appear on Bloomberg and CNBC and willingly offer their market thoughts. From what I’ve heard, and this is true nearly across the board, investors appear pretty darn confident about the prospects for stocks because these same folks believe Jerome Powell will “send it in.” Nobody, I believe, dissembles on television or radio or in the print media and then runs a portfolio opposite to their public comments.
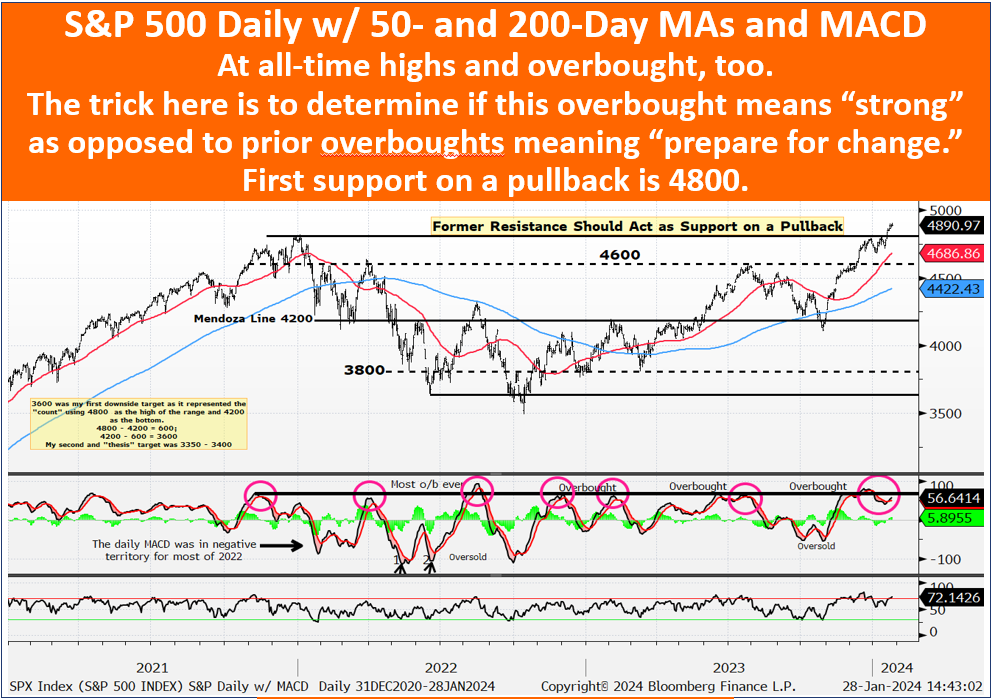
With such sanguine investor sentiment plus overbought daily and weekly conditions for the major indexes (and near overbought monthly readings, too), it’s tempting to look for a pullback. But what are we playing for here? First support on a pullback is 4800 and then 4600 after that but I think we’re going to need more than an overbought reading to get the S&P down more than 5%. In the meantime, there are other things to watch.
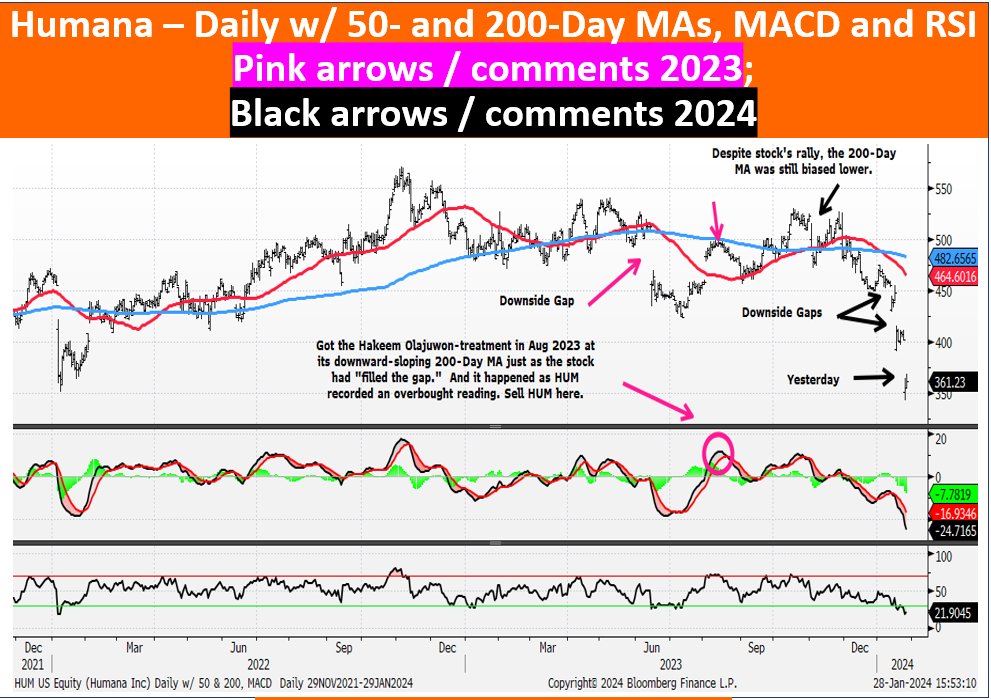
There’s a famous saying – I think it was by Casey Stengel, who had a lot of famous sayings – that goes something like this, “Nothing good happens after midnight.” Altered a bit for my purposes the saying comes out like this, “Almost nothing good happens below a downward-sloping 200-Day Moving Average.” Humana (HUM) has been a good example of this, and Tesla (TSLA) is the latest example.
 Back on October 31, 2023, I sent out a chart spotlight on Tesla where I said that, when viewed via the monthly chart included in the note, the stock looked like it was making a Head & Shoulders top. Its Technical Score at the time was = 1 and I said it had risk to $100. The stock dipped to $194 on the day of the note and then turned and rallied 36% over 39 days to give me a giant helping of humble pie for being exactly wrong. But, since I think stock opinions are like at-bats where you’ve got to forget your strikeout and continue to be aggressive with future at-bats I tried with TSLA again on Jan 14, 2024 with “Tesla Girls” and these comments: “Using Tesla Girls as today’s title, however, seemed a decent way to call attention to the weakening trading action for Tesla – the stock trades like it can’t find a charging station. While it has not broken down or failed on an absolute basis, TSLA does appear a bit frail and feeble on a relative basis vs. the S&P 500. $200 is the key level for TSLA, but man does it trade like it can’t find a charging station.”
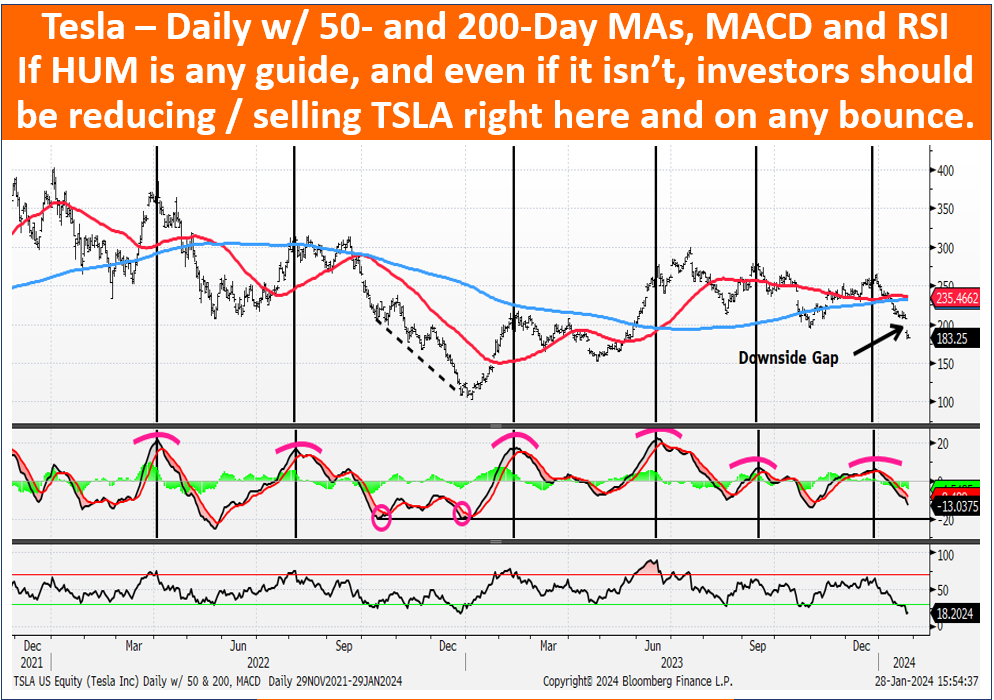
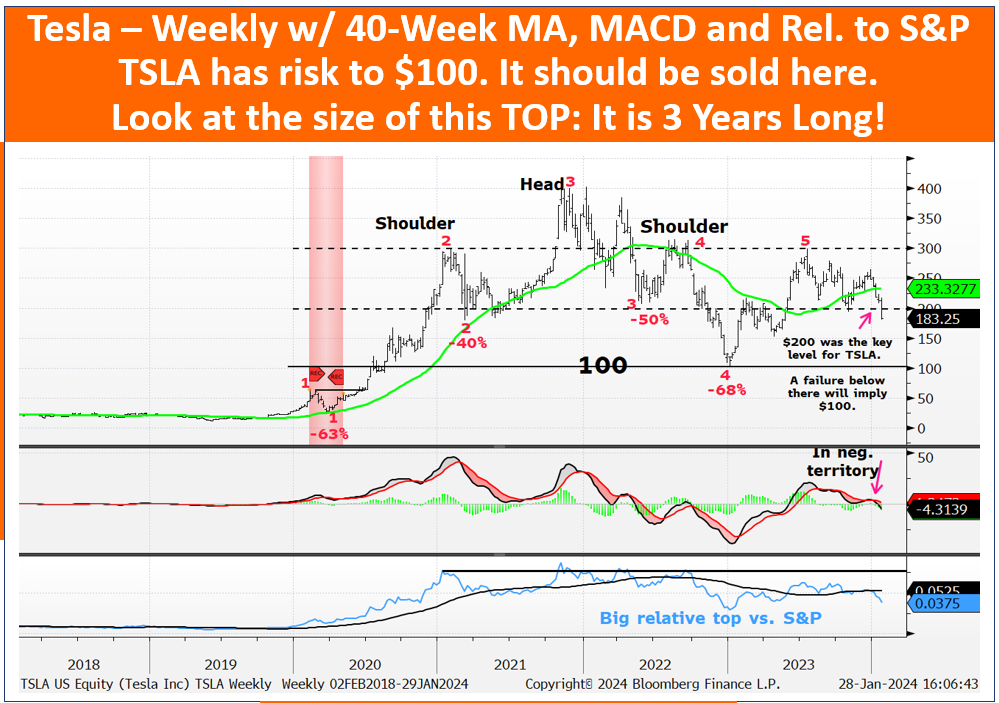
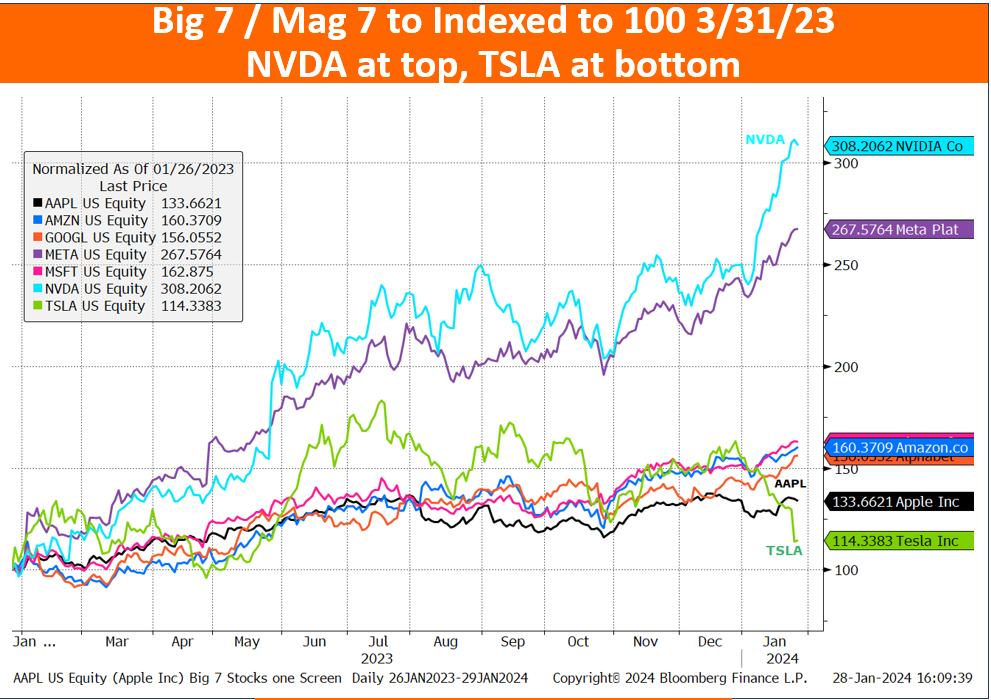
Technicals are a bit sloppy for Apple but, make no mistake, the Scarlet Letter is T for TSLA.
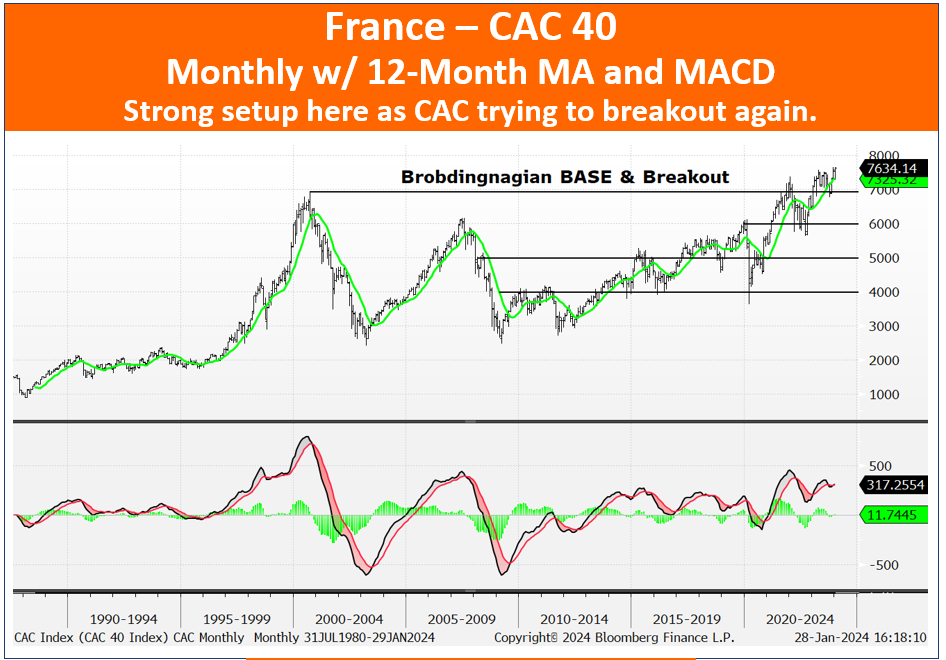
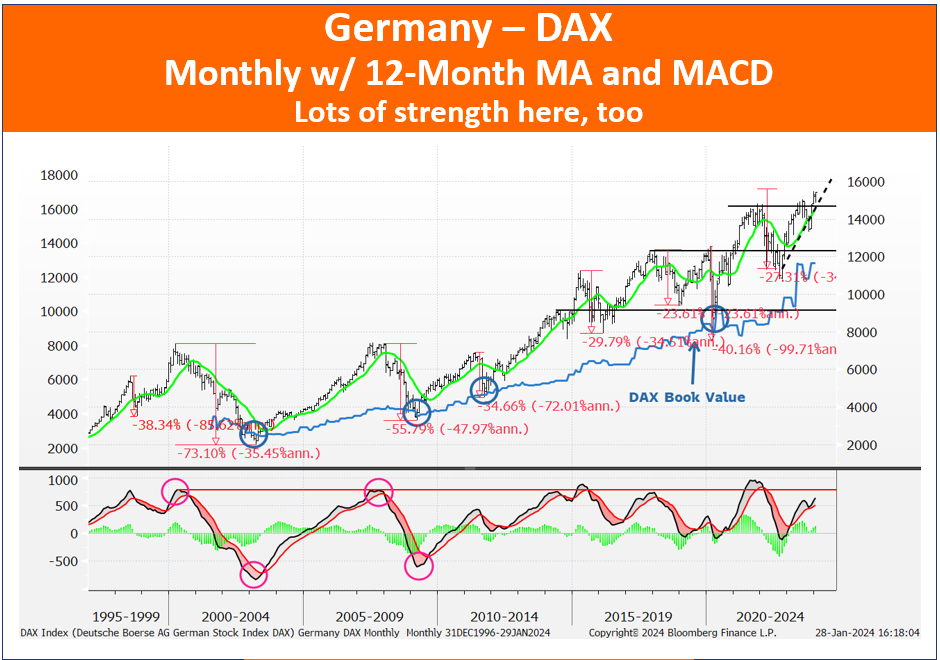
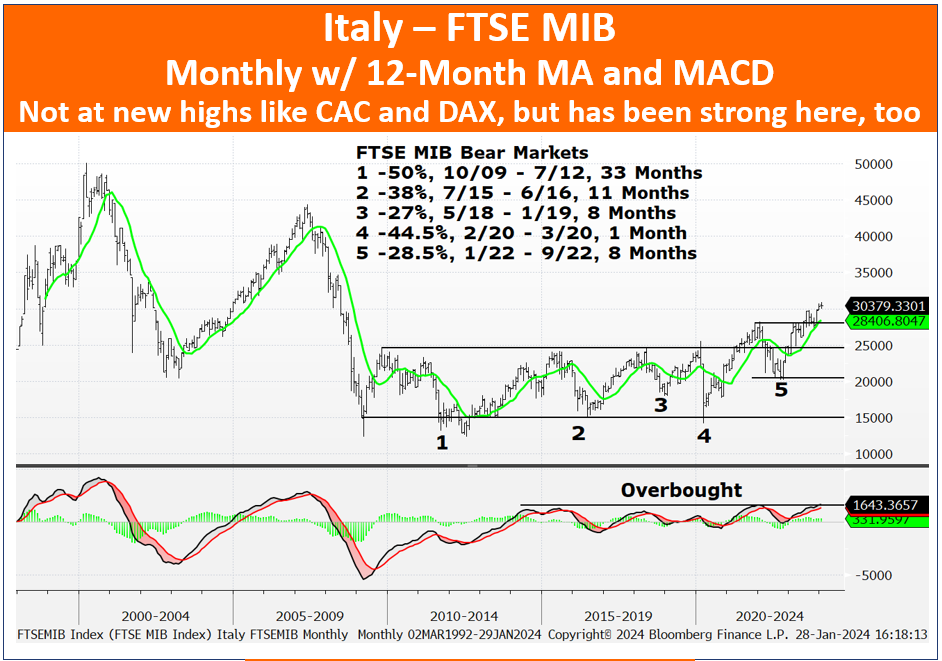
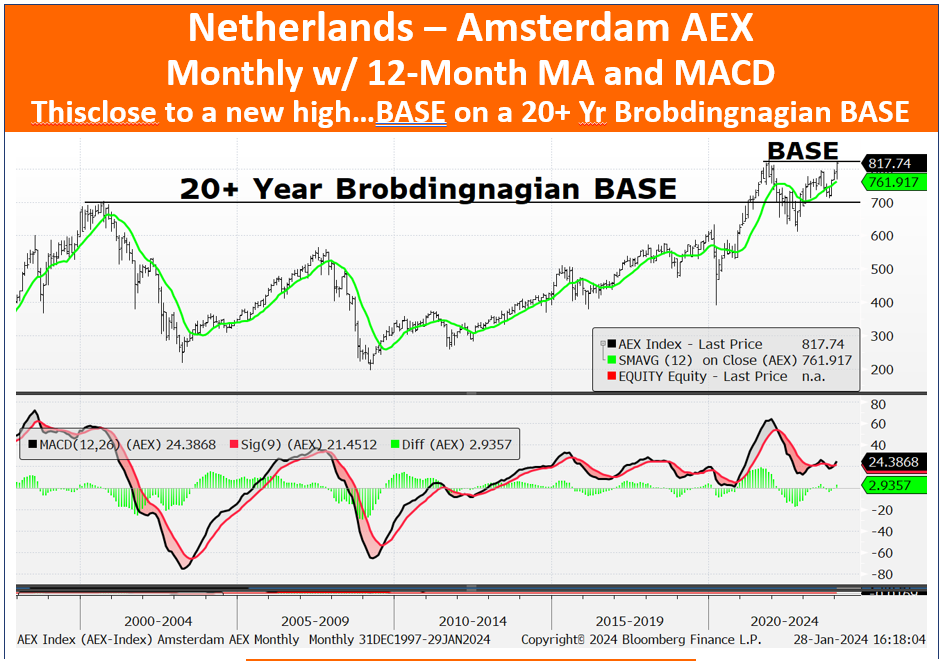
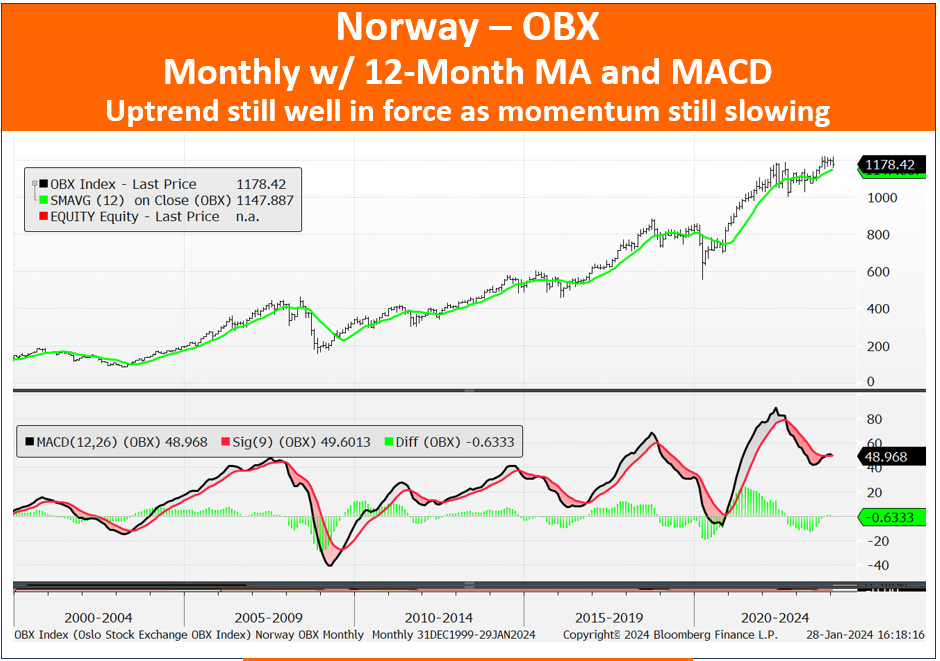
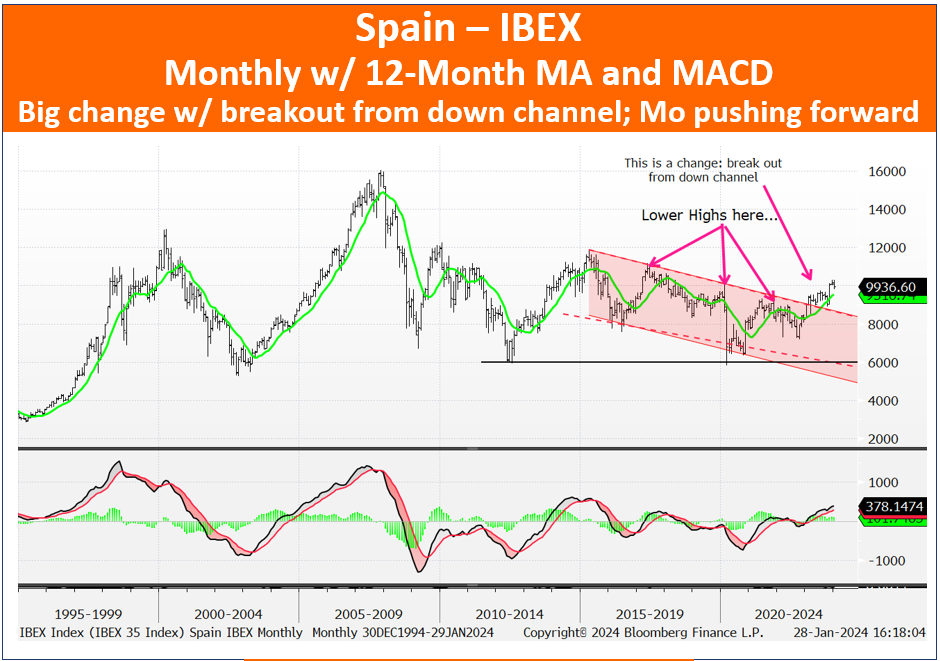
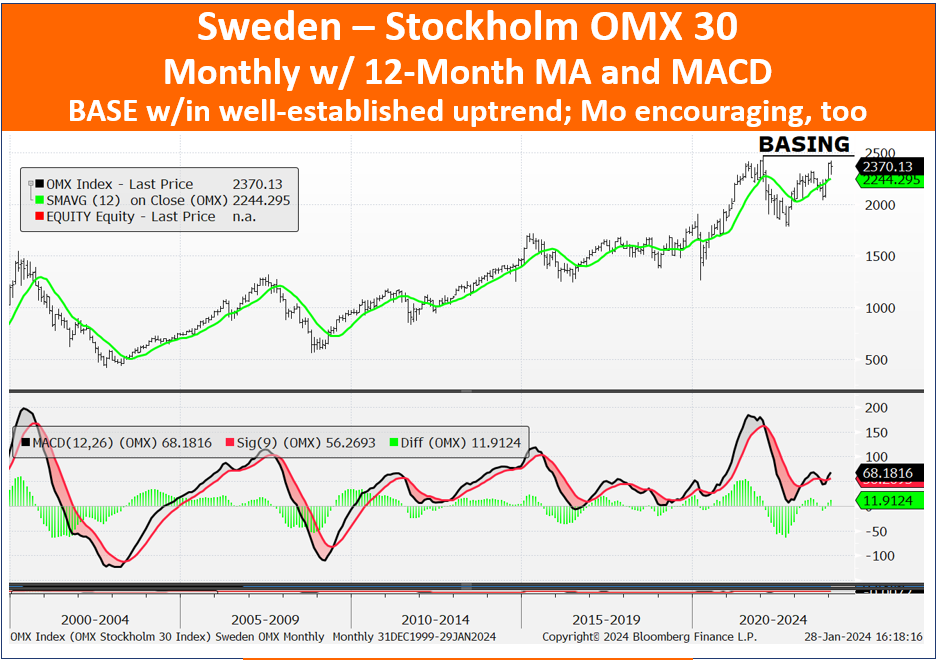
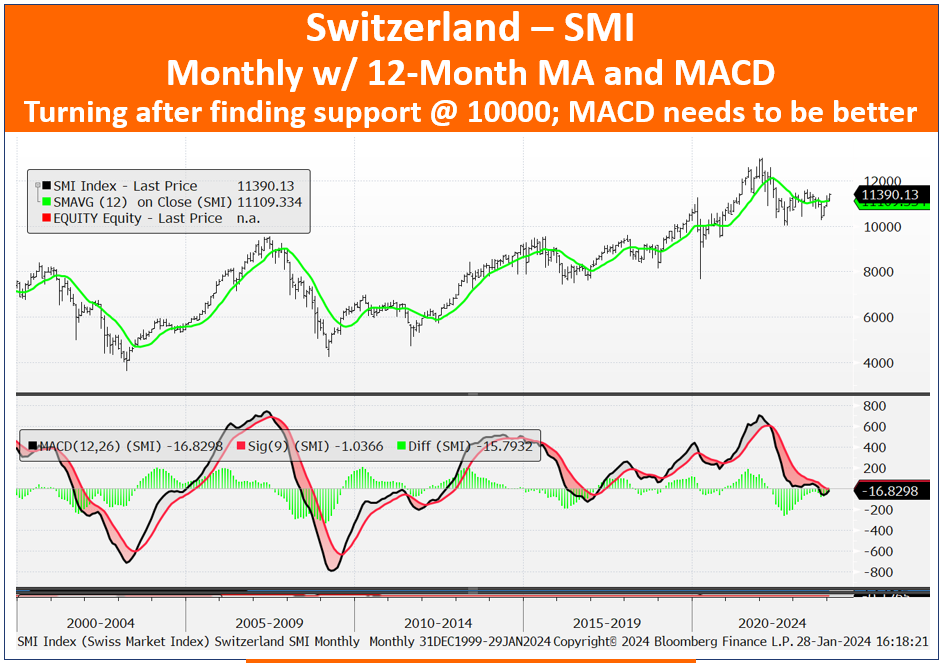
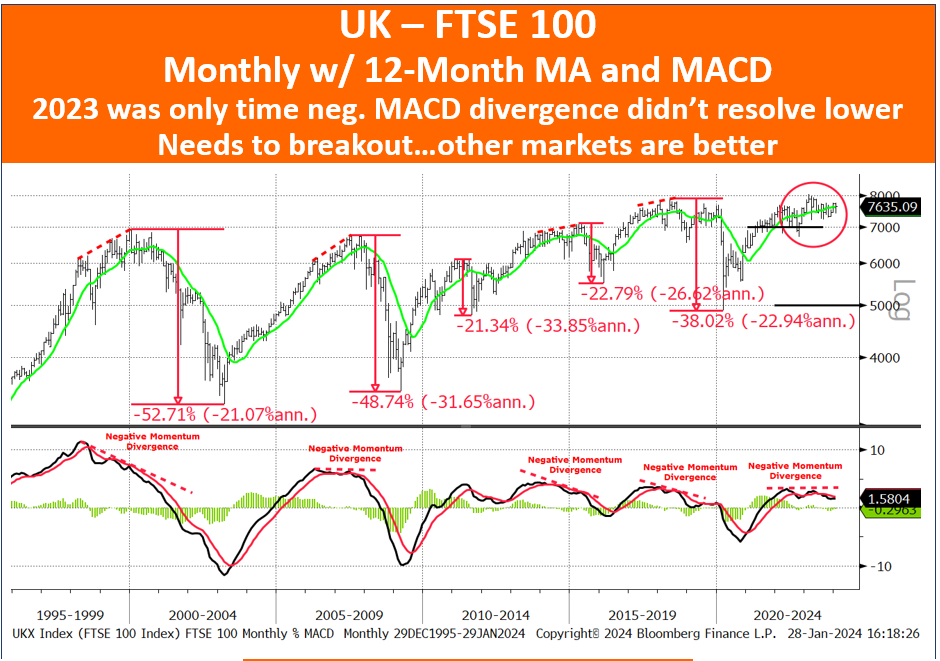
Dennis DeBusschere spent last week in Abu Dhabi, Dubai, and London and – per his report from earlier today – said, “It is commonly believed that the US is a relative winner in 2024 given European and China economic growth concerns.” I’ve heard similar concerns from the folks I speak with and while China and HK have been in bear markets for nearly 3-years long and 6-years, respectively, Euro equity markets say something different.
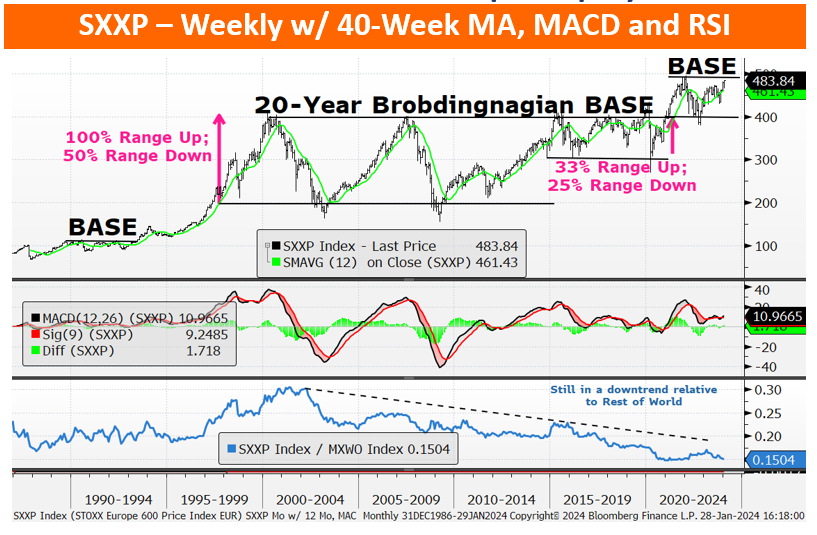
SXXP Monthly w/ 12-Month MA, MACD, & Relative to Rest of World: The BASE on a BASE pattern is a constructive setup and the Index is above its upward-sloping 12-Mo MA.
Also, the Monthly MACD is in good shape. The Index is weak relative to ROW, but that’s probably because it’s hard to compete with the US and its Tech weighting.
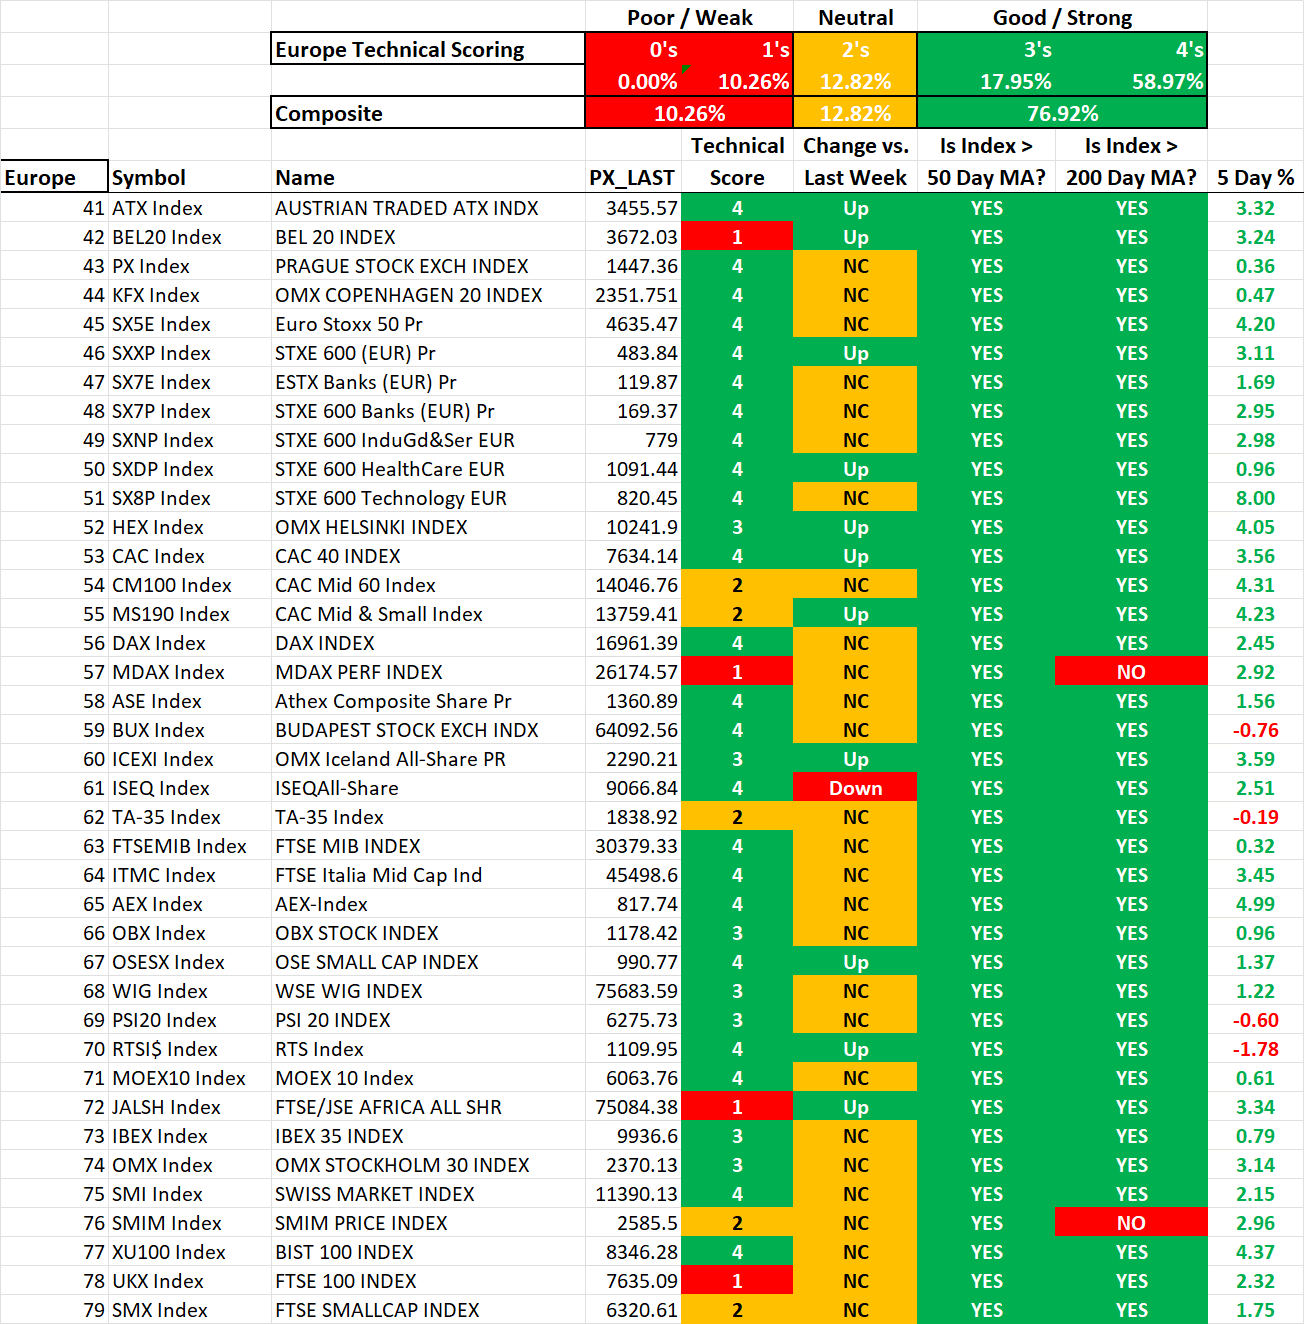
Please check the table below for a glance at the Technical Scoring results for European Equity Markets. The Composite Scores have 77% with Good / Strong Scores and only 10% with Weak Scores. Send me an email if you want to see Technical Scores for the Biggest 400 Market Cap Stocks globally. (The following table is courtesy of me / 22V Research)