

This note assesses productivity and cost trends in the US nonfarm business sector. It draws two main conclusions that relate to how we should interpret the implications for inflation of wage data from outside the official Productivity and Cost (P&C) report.
- Productivity growth is notoriously difficult to forecast, but there is little reason to believe the underlying trend has recently shifted higher. The official data have recently looked somewhat strong, but the odds are that they are overstated for reasons that are analogous with how the GDP likely overstates aggregate demand and output growth. The confident dove looking for both the GDP to be revised lower and for strong productivity to mitigate the effects of solid wage growth may be double counting.
- Properly measured, there has been little change of the labor share of business sector value added since immediately before the Covid shock. The share went up steeply during the recession, collapsed during the subsequent fiscal-fueled demand boom, and has recently been edging higher again. But it is little changed on balance. This undermines the widely circulated view that recent (real) wage strength is just “catching up” to the earlier spike of inflation.
The fourth quarter P&C report will not be released until Thursday, a day after the FOMC and Q4 ECI that may have some influence on the Fed. However, that delay does not matter much. With the GDP and employment report for Q4 and December respectively in hand, the consensus has worked up estimates that should not be too far off. And perhaps more to the point, the underlying trends in the P&C report matter more than any single quarterly print. That distinguishes P&C slightly from the ECI, where a single print can have a larger immediate impact.
The consensus estimates that productivity in the nonfarm business sector rose 1.6% (a.r.) during the fourth quarter. That would be a solid result, particularly coming on the heels of earlier very strong gains of reported productivity. For example, it would leave the 4-quarter growth rate at 2.4% and the level of productivity somewhat above its post-GFC trendline, which incorporates a presumed growth rate of 1.1%.
Notoriously difficult to project, but little obvious pressure to revise our sense

Source: Federal Reserve Bank of St. Louis (FRED), BEA (for adjustments), FH calculations and consensus estimate
Data are actual to Q3 and screen consensus for Q4.
However, the official productivity data and the unit labor cost figures derived from them are both affected by the same measurement issue affecting the GDP. That is, the GDP has been growing much more quickly than Gross Domestic Income in recent quarters. And the consensus among experts in this area is that we should probably swap out the GDP in favor of Gross Domestic Output (GDO, the average of GDP and GDI) when trying to discern how aggregate demand, output and income are actually behaving. The output figures used in the Productivity and Cost report are measured from the expenditure side, just as the GDP is. So, they would be affected by this issue. Indeed, the gap between GDP and GDO is likely to be disproportionately important to the output (or value added) figures in the Productivity and Cost report. But it is a simple calculation to correct the productivity and unit labor cost figures to put them on the same logical footing as the GDO, in the interest of consistency and of ideally being less wrong.
The adjustments I impose here have no effect on estimated productivity growth for the fourth quarter, because we have no measure of the GDP vs GDO gap for the quarter. (The GDO is likely to have grown at a different rate than GDP, but we cannot say which way.) However, the adjustment does have a big effect on the 4-quarter growth rate, cutting it in half from the 2.4% figure mentioned above to just 1.2%. Closely related, when these data are assessed in log level rather than growth rate terms, as is conventional, they provide no evidence that productivity growth has inflected higher from the 1.1% rate that has held since the Global Financial Crisis.
In making this point, I am relying on data eyeballing rather than a formal growth accounting framework. But the considerations that bear on one also bear quite closely on the other. The median guesser on the FOMC, for example, puts potential GDP growth at 1.8%. Assuming population growth of 1% and a 30 basis point drag from a secular decline in the labor force participation rate, would imply 70 bps a year of labor input growth. That plus 1.1% growth of productivity would get us to the Fed’s figures, although I am making up rather than reporting their assumptions, and the inferred Fed guess for productivity would relate to economy-wide productivity (including government), rather than to the business sector exclusively. And even within a growth accounting framework, an absence of an inflection higher in (correctly measured) productivity growth would map to an absence of pressure to revise higher prospective productivity and potential GDP growth.
Key measures of nominal wage growth have come down from the peak, but have tentatively stabilized at a high level
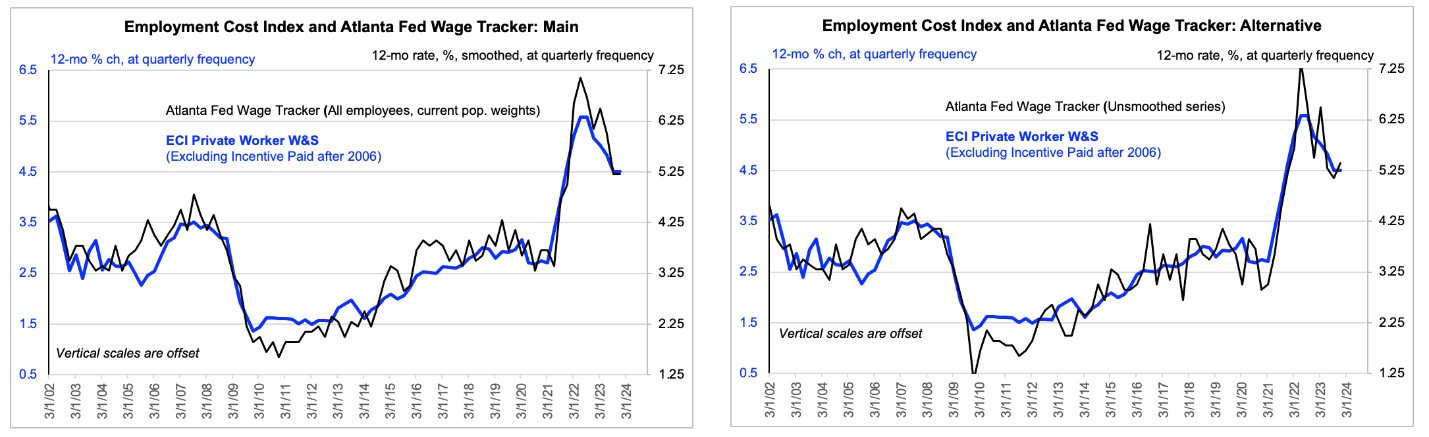
Source: Federal Reserve Banks of Atlanta and St. Louis (FRED), FH calculations
Wage Tracker is actual to December. ECI is actual to September and consensus (as I infer it) for December. All data are presented at quarterly frequency.
A key implication of this inference is that we have to be careful getting too excited about the recent moderation of nominal wage growth, particularly given that it has come in the wake of a steep deceleration of output price (i.e., goods and services inflation, as I will touch on further below). For example, what would we make of the notion that the core ECI is running at a 1-quarter rate of 4% and a 4-quarter rate of 4.5%, as the consensus has penciled in for Wednesday?
Let’s work with the lower quarterly figure in the interest of simplicity and of not overstating our point here. We watch the ECI rather than Average Hourly Compensation (AHC) data from the P&C report because the ECI is less subject to mix shift and therefore gives a better sense of the underlying trend of broad labor costs than the AHC itself might. And yet somewhat ironically, we are interested mostly in what the underlying trend of the AHC might be, because that is most directly comparable with trend productivity. And the best guess of underlying AHC growth is what the ECI implies plus about 50 basis points, to accommodate the trend mix shift that is one of the drivers of trend productivity (as people migrate to higher productivity employment over time.) So, this means we are looking at 4.5% nominal compensation growth less about a percentage point for productivity, leaving just under 3.5% underlying unit labor cost growth, at least if we look robotically but objectively at the trailing data to date.
I would be the first to concede that such an approach could be misleading. It is possible that the failure of the productivity trend to falter durably in the wake of the Covid shock is actually evidence that the underlying trend there is inflecting higher, and that this will become obvious over the next couple years. Alternatively, the tentative stabilizing of ECI and Wage Tracker growth (at too high a level) after a period of steep disinflation may indeed be tentative. It is worth keeping an open mind here and on recognizing that labor cost growth may not be the main determinant of underlying inflation. Certainly, the news in goods and services inflation in recent months has been very encouraging. Nevertheless, I think the base case here has to be that ECI growth in a range of 4% to 4.5% is probably a little too high for the Fed’s comfort, all else equal, which I concede it is not.
One popular retort to the claim that underlying labor cost inflation seems to be running too hot is that this is just a benign “catch up” to the earlier spike of output price inflation, which reduced real wages and in particular the labor share of value added. However, there are two problems with the retort. First, it might explain a period of above-trend wage growth, with little to no implication for inflation. But it would be a stretch to have it explain the recent pattern of apparently accelerating real wage growth. Second, I suspect that the premise underlying the argument is simply false.
The labor share of value added can be defined as the ratio of unit labor costs to the value added deflator. We already have the Q4 value added deflator for the nonfarm business sector from the Q4 GDP release. And we can work up an estimate of “adjusted” unit labor costs by applying the same scalar to those as we apply (in the opposite direction) to reported productivity. The chart above shows the result of these calculations, which were alluded to near the top of this note. The labor share has made some wild oscillations over the past few years, but it has recently been edging higher and it happens to have achieved no cumulative change since just before the Covid shock.
And this is relevant because the labor share applying in the fairly serene environment just before the Covid shock should probably be taken as the least unreliable benchmark of “equilibrium” there. To be sure, the labor share was lower at the end of 2019 than it had been on average in the post-WWII data. However, the idea that the labor share should mean revert at such a low frequency is challenged by the fact that there have been structural influences on the labor share that are likely to be enduring. Think market power, biased technology advance, globalization, the decline of labor unions, etc. As a best guess of “normal” it is probably far better to use conditions immediately before the Covid shock and wild policy reaction to it. And if we do that, an obvious question arises. What is strong (real) wage growth presumably catching up to?
The labor cost issues discussed in this note are by no means the only issues bearing on inflation or on the Fed decision on Wednesday. I just think the are a relevant partial offset to some of the more dovish considerations, such as steeply lower goods and services price inflation. I will pay close attention to what the Q4 ECI actually brings and then (possibly) to what the Fed has to say on Wednesday. For example, if Powell expressed some concern over labor costs, I would be inclined to take that more seriously than others might.
The labor share is unchanged from pre-Covid, which might be a decent benchmark of “normal”
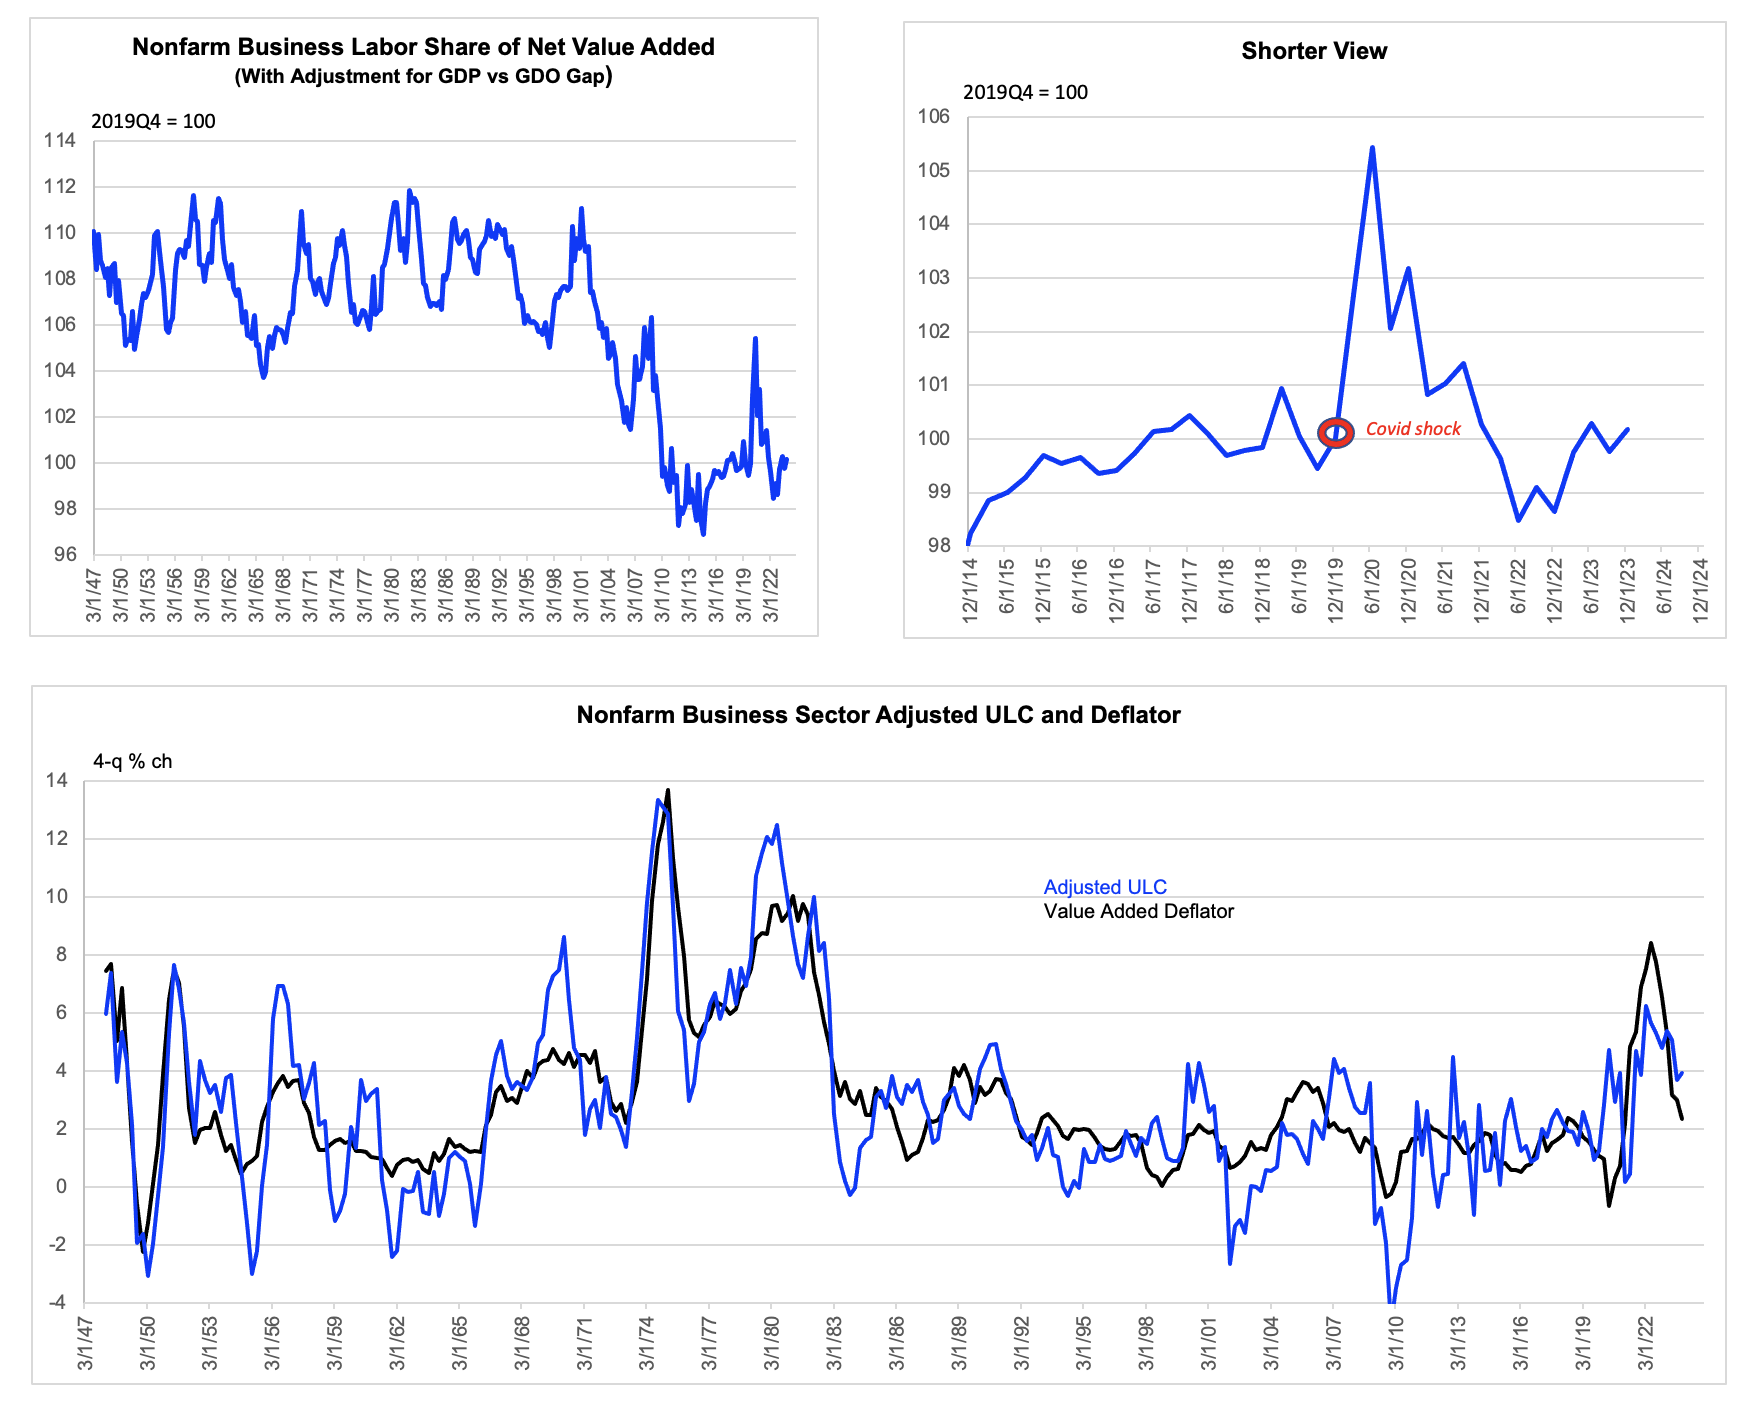
Source: Federal Reserve Bank of St. Louis (FRED), BEA (for adjustments), FH calculations
Data are actual to Q3 and implicit consensus for Q4.

