

It is obviously not a focus for today, but I pay close attention to developments in residential investment because they bear directly on the debate over whether the lagged effects of earlier monetary tightening are still mainly to play out. (I pick not.) And the detail on residential investment released in today’s GDP report seems to illustrate why residential investment, which is the most interest-sensitive component of aggregate demand, seems unlikely to generate much headwind against aggregate demand growth, at today’s level of mortgage yields.
Broker commissions prevented much rise of residential investment in Q4

Residential investment spending figures are actual to Q4. Starts and existing sales are quarterly averages to Q4 and then the December values are extrapolated into Q1 for purposes of illustration.
Consider the chart above. The blue lines show the levels of the four main components of residential investment through the fourth quarter, with the chart subtitles indicating each component’s share. The four components shown comprise just over 98% of the total. In all cases except for home improvement spending, I show the quarterly averages of the monthly housing indicators that correlate with the relevant measure of residential investment within the GDP report. And just for illustration, I show how those quarterly averages would look for Q1 if the December monthly prints were to hold through Q1.
An interesting pattern emerges. Single family residential investment is running about as far below what is implied by single family starts as multifamily residential investment is running above multifamily starts. It is just over 15% in both cases. However, the value added in single family construction is three times as large as that in multifamily, because there are more units involved and because the value added per unit is higher in single family. So, total new home construction (single plus multi) seems more inclined to tilt higher than lower during the first half of this year.
Meanwhile, home improvement spending, for which I do not have a monthly indicator, appears to have put in a tentative bottom, at some of falling into technical analysis of economic data. The stronger point here perhaps is that home improvement spending seems to follow roughly the same cycle as new home construction, for obvious reasons, although its post-Covid-shock spurt predated that for single family construction.
The outlook for brokerage commissions is a bit more imponderable. They fell at an annualized rate of 28% in the fourth quarter, which is why residential investment spending growth was confined to just 1%, despite the 11% gain in the single family construction component of residential investment. The odds are that this drag goes away soon, simply because existing home sales have apparently stopped collapsing. But what of the longer outlook? Existing home sales are likely to be held down by the widely heralded mortgage lock-in effect. With today’s GDP report we got an update of the average effective yield on the existing mortgage stock, and it rose only marginally from 3.74% in Q3 to 3.80% in Q4. So, the lock-in incentive is still quite strong. However, it is no longer increasing, as market mortgage yields have actually come meaningfully off their high. A renewed collapse of existing sales, then, seems quite unlikely from this level. And that is probably a strong enough result to tilt the path of overall residential investment spending marginally positive, given that brokerage commissions are not a particularly large share of overall residential investment spending.
There is one caveat here that I should concede before ending. Near the top of this note, I mentioned that the very short run outlook for single family residential investment spending is about as strong as the outlook for multifamily is weak. That might not be so of the longer-term outlook, even at the current level of mortgage yields. The reason is as follows. Leaving aside the short term signal from the trend in starts, it does seem obvious that multifamily residential investment spending has plenty of room below. If I had to guess, I would think that multifamily residential investment will fall more in percentage terms over the coming year than single family will rise. Looking out a year, rather than just a couple quarters, the stronger point for the demand bull to make here is the simpler point: that single family construction contains three times as much value added as multifamily.
Residential investment spending seems very unlikely to boom from here. And we cannot generalize about the (presumably lowered) interest sensitivity of aggregate demand from the fact that most of residential investment spending is disinclined to fall off the floor. That would be double counting. But the most prominent source of aggregate demand drag typically found in the wake of a tightening cycle seems by now largely to have been spent. I think we can rely on that.
Mortgage lock-in effect remains strong but is perhaps no longer intensifying
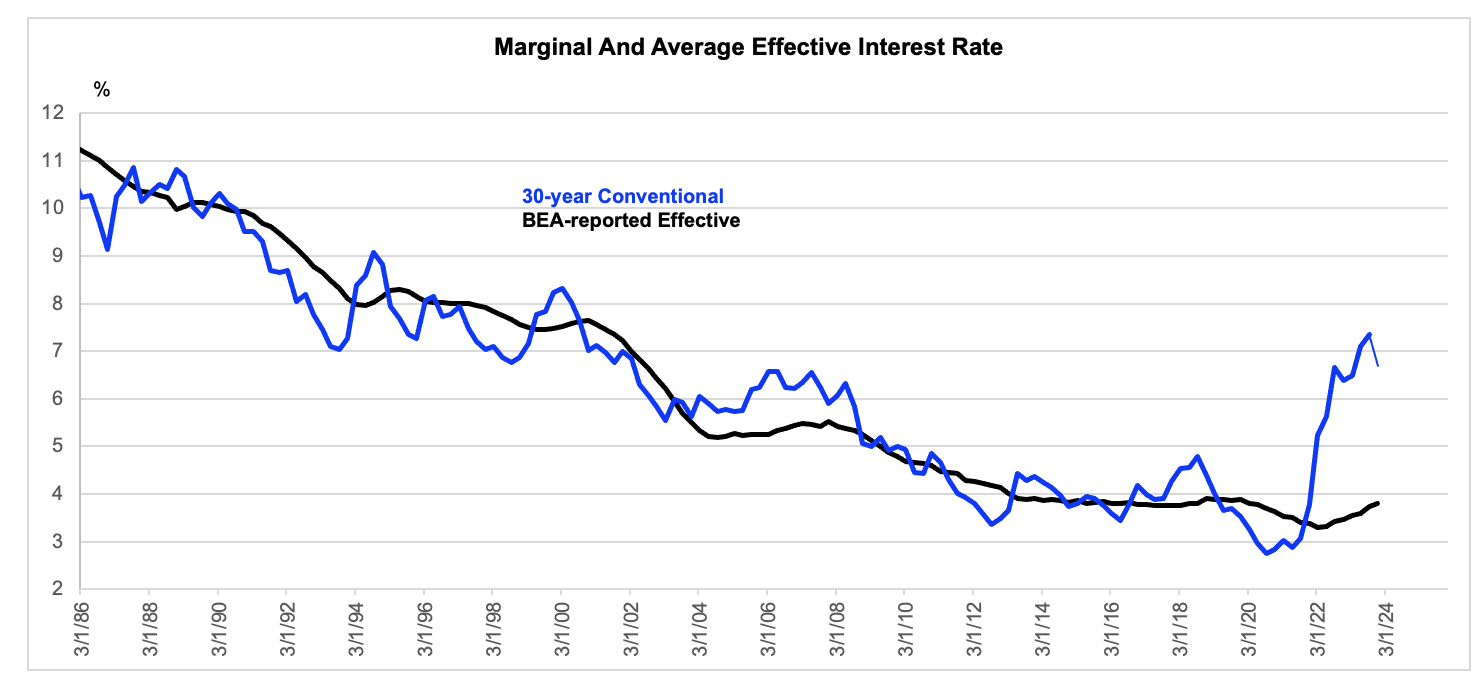
Effective rate is actual to Q4, as published in this morning’s GDP data. Market rate is quarterly average to Q4 and then current value penciled in for Q1.

