Back Economics

Consensus wrong about self?

Published on January 23, 2024

∙ Download the PDF Report

By

Gerard MacDonell

This note provides a brief assessment of how to interpret the consensus guess for the fourth quarter GDP release, due on Thursday. The main contention here is that the consensus has a stronger view of the economy than the consensus realizes, although this is slightly less the case for my single favorite measure of underlying demand. 

The screen consensus has the GDP rising 2% (ar) during the fourth quarter. Built into that is just over 50 bps of drag from net exports and (especially) inventories collectively. And government spending is roughly neutral. So, the implied consensus for final sales to private domestic purchasers (FSPDP) is a gain of 2.5%. That would bring the 2-quarter growth rate there to 2.8%, which would be the strongest 2-quarter gain since the peak of the stimulus-fueled mid-Covid bounce.  See the right panel of the chart below for a picture of that in level terms. 

Conventional measures of aggregate demand

A graph of different colored lines

Description automatically generated with medium confidence

Source: BEA, FH calculations and estimates

Data are actual to Q3 and implied consensus for Q4.

The demand bulls, among whom I tend to include myself these days, now seem to have forgotten about the GDP – GDI distinction that was a focus two to three quarters ago.  But the case for using the average of GDP and GDI (i.e., GDO) as the better proxy of aggregate demand has not gone away.   There was recently a technical reason for being suspicious about that because of a weird handling of Fed portfolio losses, but the bean counters have fixed that issue, so far as I understand. So, let’s take a look at GDO and then an analogue of final sales to private domestic purchasers adjusted for the same consideration, which I concede involves taking some liberties. As often, I am going for less wrong here.

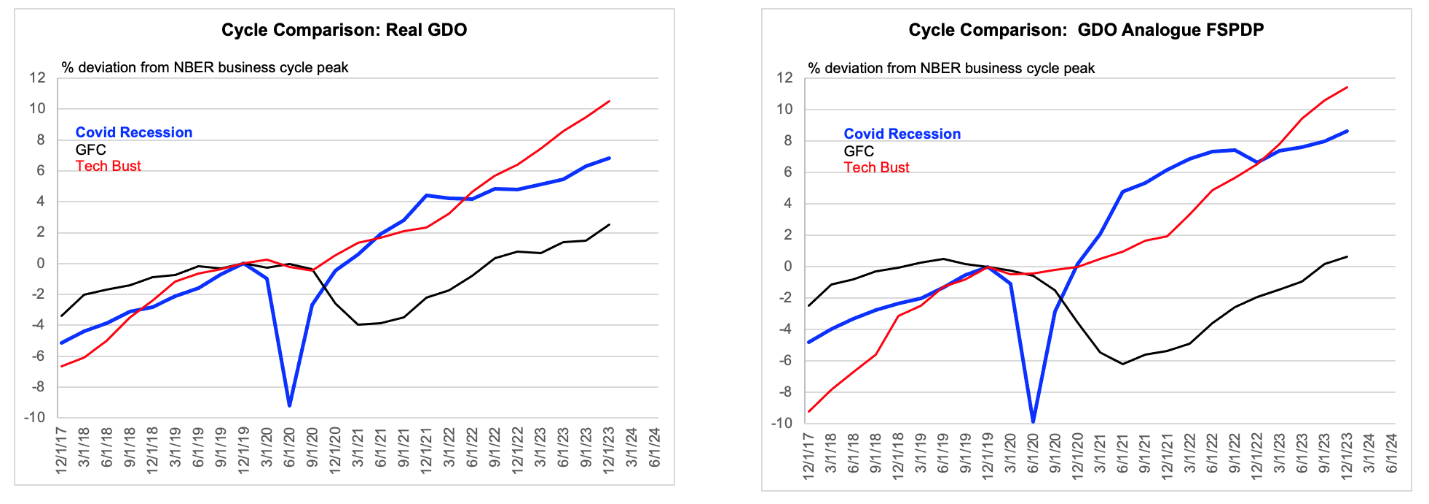
We have no reason to believe that the bean count for GDO should be any different from that for GDP. When the data come out, the growth rates there will almost certainly be different, but we have no basis at this point for saying which way.  With GDI below GDP in level terms, we might expect some catch up, which would redound to the favor of the demand bulls.  But the evidence does not suggest a catch-up effect, according to analysts who have actually looked into this formally.  So, we have GDO up 2% in Q4 and at an annualized rate of 2.6% over the past two quarters, as the left panel of the chart below shows.

Incorporating the GDP – GDI distinction, including with a minor kludge
A graph of different colored lines

Description automatically generated with medium confidence

Source: BEA, FH calculations and estimates

Data are actual to Q3 and implied consensus for Q4.

We can work up an analogue for FSPDP by taking the standard measure and multiplying it by the ratio of GDO to GDP, admittedly a minor kludge. That would be up 2.5% in Q4 and at an annualized rate of 1.9% during the two quarters to Q2.  In fairness, 1.9% is not that strong, and yet it is my single best guess of the underlying trend of aggregate demand growth, because I do not discount the GDI vs GDP distinction. Still, the pattern is a quickening one. These would be the strongest results for the 1- and 2-q growth rates there in six quarters. 

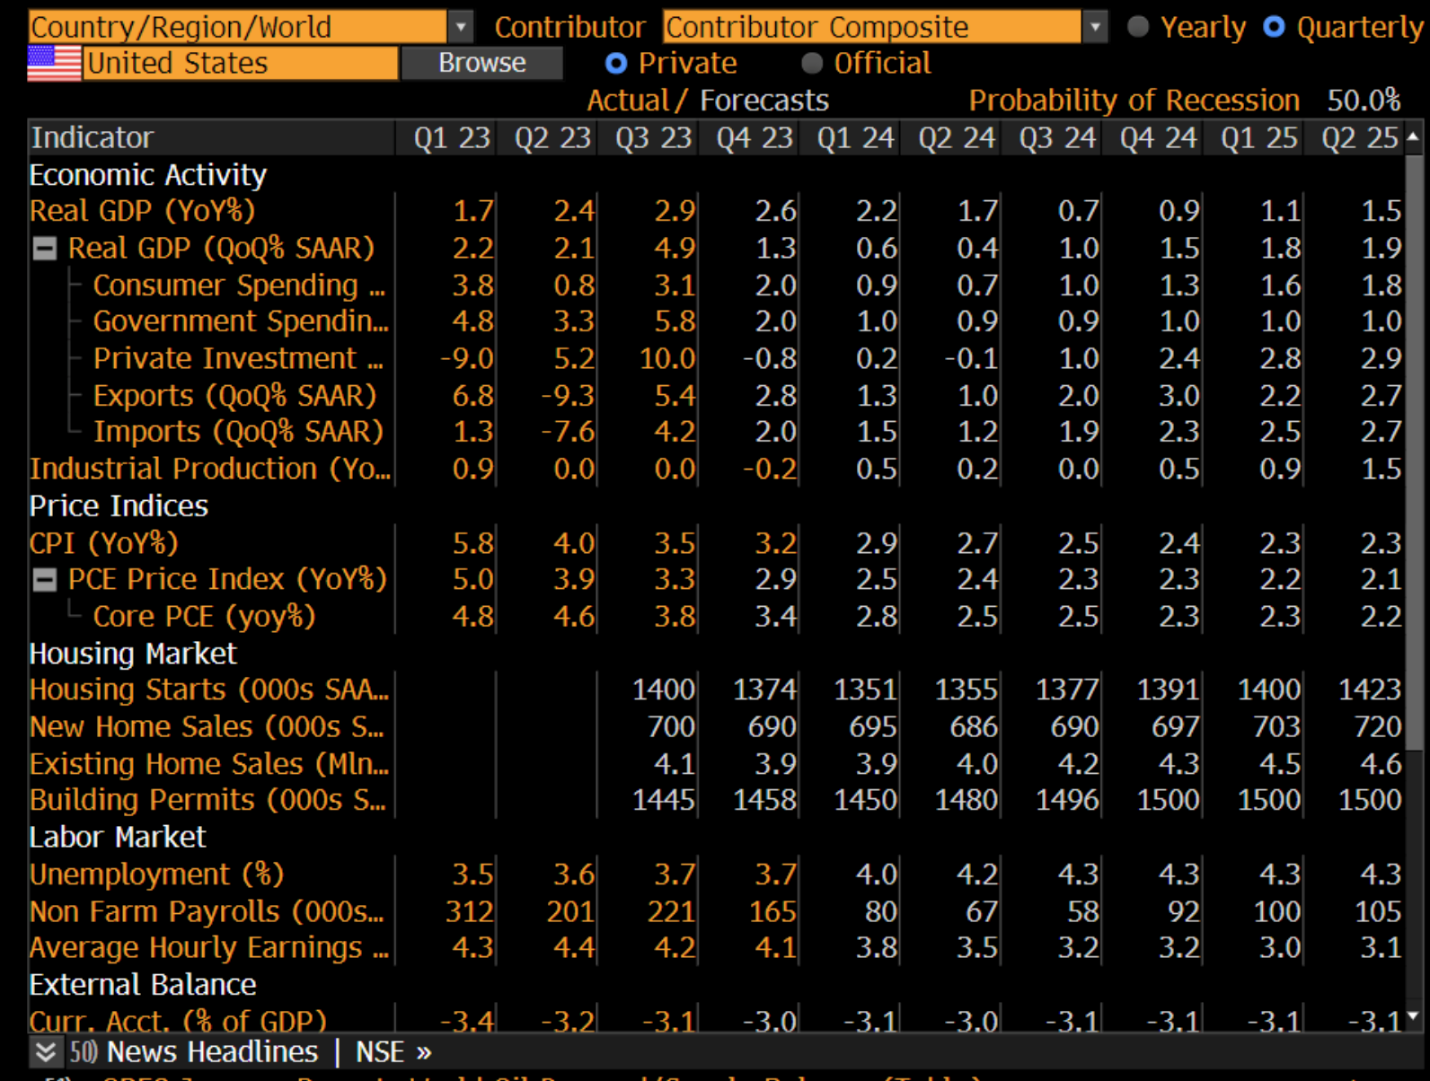
I had a discussion with colleagues Peter and Kevin about the consensus’s very weak outlook for growth in Q1. We were wondering if the Bloomberg numbers are actually stale or if they are a current read of estimators who just update the priors slowly.  I have been assured by Bloomberg staff that the numbers are current in the sense of reflecting what the guessers are actually saying, but I concede that the gap between what is on ECO (2%) and ECFC (1.3%) for even Q4 GDP is a fly in the ointment. Whatever the case, what is on ECFC does seem low. I badly assert that the typical guesser there is leaning heavily on priors and maybe a bit less so on the more typical approach of just applying a sense of momentum overlaid with whatever technical issues in the GDP bean count might be relevant. For example, after the inventory drag, we all have slated in for Q4, the flow of inventory investment would be “normal,” that is, inclined neither to accelerate nor decelerate on the basis of mean reversion considerations, which do in fact work.  

Where my own take would be exposed here would be around the January employment report, due February. So far, the screen consensus of a 145k gain in private jobs, is fully with me. But we shall see. 

We might be wrong ourselves, but we were wondering if the survey is stale or the submitters sluggish
A screenshot of a computer screen

Description automatically generated

Source: Bloomberg ECFC

DISCLOSURES AND DISCLAIMERS

Analyst Certification

The analyst, 22V Research Group, primarily responsible for the preparation of this research report attests to the following: (1) that the views and opinions rendered in this research report reflect his or her personal views about the subject companies or issuers; and (2) that no part of the research analyst’s compensation was, is, or will be directly related to the specific recommendations or views in this research report.

Analyst Certifications and Independence of Research.

Each of the 22V Research analysts whose names appear on the front page of this report hereby certify that all the views expressed in this Report accurately reflect our personal views about any and all of the subject securities or issuers and that no part of our compensation was, is, or will be, directly or indirectly, related to the specific recommendations or views of in this Report.

22V Research (the “Company”) is an independent research provider. The Company is not a member of the FINRA or the SIPC and is not a registered broker dealer or investment adviser. 22V Research has no other regulated or unregulated business activities which conflict with its provision of independent research.

22V Research, LLC is a professional services and independent publication organization. 22V Research, LLC is not a securities broker-dealer, not a member of the Financial Industry Regulatory Authority (FINRA), not a registered investment advisor (RIA) and not a member of SIPC.

Securities transactions, when offered, are offered by 22V Securities, LLC through LPS Capital, LLC. Certain employees of 22V Securities, LLC are dually registered as securities representatives of LPS Capital, LLC or Analyst Hub Securities, LLC. 22V Securities, LPS Capital and Analyst Hub Securities are members FINRA, SIPC.

https://brokercheck.finra.org/

Current Ratings Definition.

SECTOR OUTPERFORM: An “outperform” rating anticipates the company will outperform the S&P Regional Banking Index (peer group).

SECTOR PERFORM: A “market perform” rating anticipates the company will perform in line with the S&P Regional Banking Index (peer group).

SECTOR UNDERPERFORM: An “underperform” rating anticipates the company will underperform the S&P Regional Banking Index (peer group).

Limitation Of Research And Information.

This Report has been prepared for distribution to only qualified institutional or professional clients of 22V Research Group. The contents of this Report represent the views, opinions, and analyses of its authors. The information contained herein does not constitute financial, legal, tax or any other advice. All third-party data presented herein were obtained from publicly available sources which are believed to be reliable; however, the Company makes no warranty, express or implied, concerning the accuracy or completeness of such information. In no event shall the Company be responsible or liable for the correctness of, or update to, any such material or for any damage or lost opportunities resulting from use of this data. Nothing contained in this Report or any distribution by the Company should be construed as any offer to sell, or any solicitation of an offer to buy, any security or investment. Any research or other material received should not be construed as individualized investment advice. Investment decisions should be made as part of an overall portfolio strategy and you should consult with a professional financial advisor, legal and tax advisor prior to making any investment decision. 22V Research Group shall not be liable for any direct or indirect, incidental or consequential loss or damage (including loss of profits, revenue or goodwill) arising from any investment decisions based on information or research obtained from 22V Research Group.

Reproduction And Distribution Strictly Prohibited.

No user of this Report may reproduce, modify, copy, distribute, sell, resell, transmit, transfer, license, assign or publish the Report itself or any information contained therein. Notwithstanding the foregoing, clients with access to working models are permitted to alter or modify the information contained therein, provided that it is solely for such client’s own use. This Report is not intended to be available or distributed for any purpose that would be deemed unlawful or otherwise prohibited by any local, state, national or international laws or regulations or would otherwise subject the Company to registration or regulation of any kind within such jurisdiction.

Copyrights, Trademarks, Intellectual Property.

22V Research Group, and any logos or marks included in this Report are proprietary materials. The use of such terms and logos and marks without the express written consent of 22V Research Group is strictly prohibited. The copyright in the pages or in the screens of the Report, and in the information and material therein, is proprietary material owned by 22V Research Group unless otherwise indicated. The unauthorized use of any material on this Report may violate numerous statutes, regulations and laws, including, but not limited to, copyright, trademark, trade secret or patent laws.
