

A Shift Higher in Neutral?
- The peak, level and timing, in the fed funds rate is going to be determined much more by the next few months data flow, especially core PCE and any additional heat on growth, and Fed assessments of the outlook and risks than any view on neutral.
- The broader issues around the timing, pace, and ultimate destination of an eventual rate cutting cycle remain largely unknown and are all heavily influenced by both the Fed’s view of neutral and the actual evolution of the underlying macroeconomic concept itself.
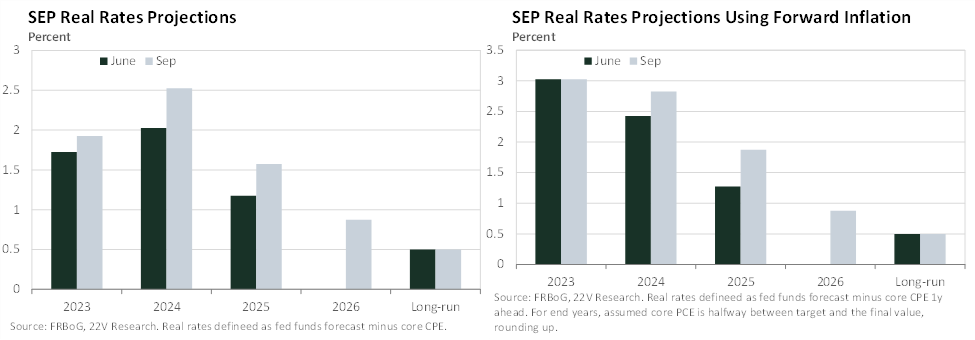
- As an important side note: it is worth remembering that the dots are a set of forecasts, made in the context of a given set of SEP submissions, and also a statement of policy communication. There clearly remain a number of data constellations, even with higher neutral rates, that could result in more rapid than expected 2024 and/or, especially, 2025 cuts.
- Chair Powell’s quip on neutral that: “we know it by its works, we only know it by its works really” suggests that reaching for a sufficiently restrictive stance is not something indexed to a long-run measure of r* but rather tied to growth and inflation outcomes and, less importantly, forecasts.
- Between the SEP and the Chair’s Press conference, the Fed seems to be behaving as though the short-term neutral rate is higher than it was pre-covid, even though the median long-run dot hasn’t shifted.
- The pattern of forecast revisions to growth and unemployment by both the private sector and the Fed seems consistent with at least a somewhat higher neutral rate, as does current market pricing.
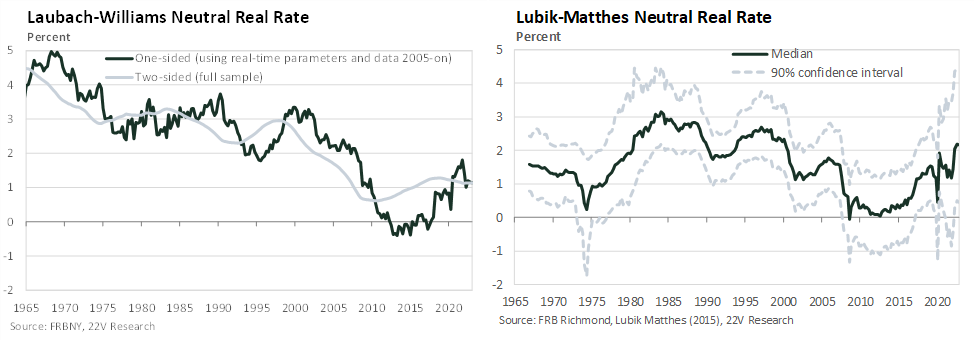
- Post-covid, the two most prominent real neutral rate models lean in somewhat different directions: the FRBNY’s Laubach-Williams suggests that r* is effectively unchanged around 1% while the FRB Richmond’s Lubik-Matthes model suggests that r* has shifted up notably to roughly 2%.
- In my view the nominal neutral rate has likely shifted up since covid likely to 3%, and perhaps up towards 3.5%.[1] This reflect both a shift up in the real neutral rate, as well as a view that the acceptable trend rate of inflation (i.e. the inflation rate where the dual mandates suggests that pushing harder against inflation is no longer worth it and the Fed switches to an opportunistic disinflation approach) for the Fed is likely closer to 2.5% than 2% for the rest of this cycle. This reflects the above as well as more qualitative views on the: green transition and associated infrastructure spending; re-regionalization;[2] and increased inflation volatility, partly as a result of the prior two.
A (Quick and Qualitative) Overview of What a Higher Neutral Rate Would Mean
- Going forward it is important to emphasize that there is a notable distinction between the modest drag on growth from steady or slowly falling restrictive real fed funds rate and the more volatility enhancing and immediately financial conditions tightening extremely rapid pace of rate hikes we have already seen.
- A higher, real or nominal, short- or long-run, neutral rate means a shorter, later, or slower (up to the Fed’s read of the data as it happens) eventual cutting cycle but also suggests less risk to the economy in the meantime (those with lots of short-duration liabilities may only ‘appreciate’ neutral moving up so long as trend GDP growth also does as well).
- Barring a large shock or clear signs of a recession, I suspect that at least the initial cut or two are likely to have a fairly low (as in with robust 2-handle) inflation realization and forecast threshold, before perhaps moving more rapidly once the Fed assesses that the initial cuts are not reigniting inflationary forces.
- Rates markets have been moving in this direction since late June (5y5y rates just recently passed their prior peak from last fall though), although the speed of the move in the last two days is surely causing some pain.
- For equity markets the tensions around a higher r* seem very apparent. This like it should be roughly neutral for topline growth. But given the higher discount rates it implies, and the apparent view that this rates move cannot be healthily sustained and is increasing recession risks, equities are taking the shift poorly.
- For the Fed, the market is currently doing much of their work for them. Modestly higher rates and lower risk assets act as natural governors on the economy that help lean against subsequent overheating (if inflation expectations deanchoring is the positive feedback loop the Fed fears, modest moves higher in rates following positive growth surprises are the negative feedback loop that helps).
- Read on for a more in-depth discussion of some inferences we can make and the existing models on the subject.

Estimating Neutral
Given it is an unobserved concept (latent in stats language), the neutral rate cannot be extracted from some already produced data set, it must be estimated using a model of some type.
This means that all the neutral rate estimates are context dependent on the specific model which generates that estimate. Practically this means that we have to take into account the other underlying assumptions about the economy and monetary policy embedded in the rest of the model and weight the results not just on model uncertainty bands but based on the quality and utility of those assumptions for the issue at hand; these are results that require appropriate skepticism and care in use.
In effect, the neutral rate estimates the models spit out is a result of growth (or the change in the output gap and unemployment rate) being faster or slower than the usual model dynamics expect. If growth is slower, or the unemployment rate falling less quickly or rising, than normal this suggests that real rates are above their neutral level and vice versa for a faster growth rate.[3] These models relate to inflation then by assuming that a zero output gap or neutral unemployment rate as that being consistent with inflation that is stable and/or at target, depending on the model.
Of course, few things are ever so clean in macroeconomics which is why there are so many models and with all manner of differing assumptions.[4] Luckily there are a few ways we can update and assess neutral without resorting to our own bespoke modeling work.
Forecast Shifts Give a Directional Clue, At Least on Short-run R*
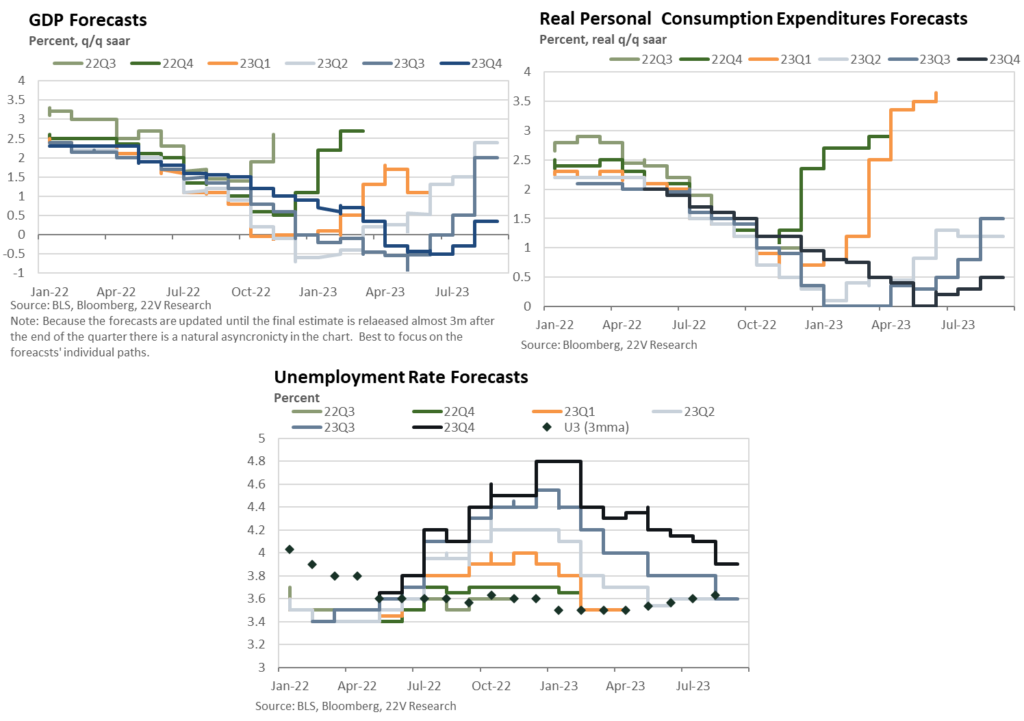
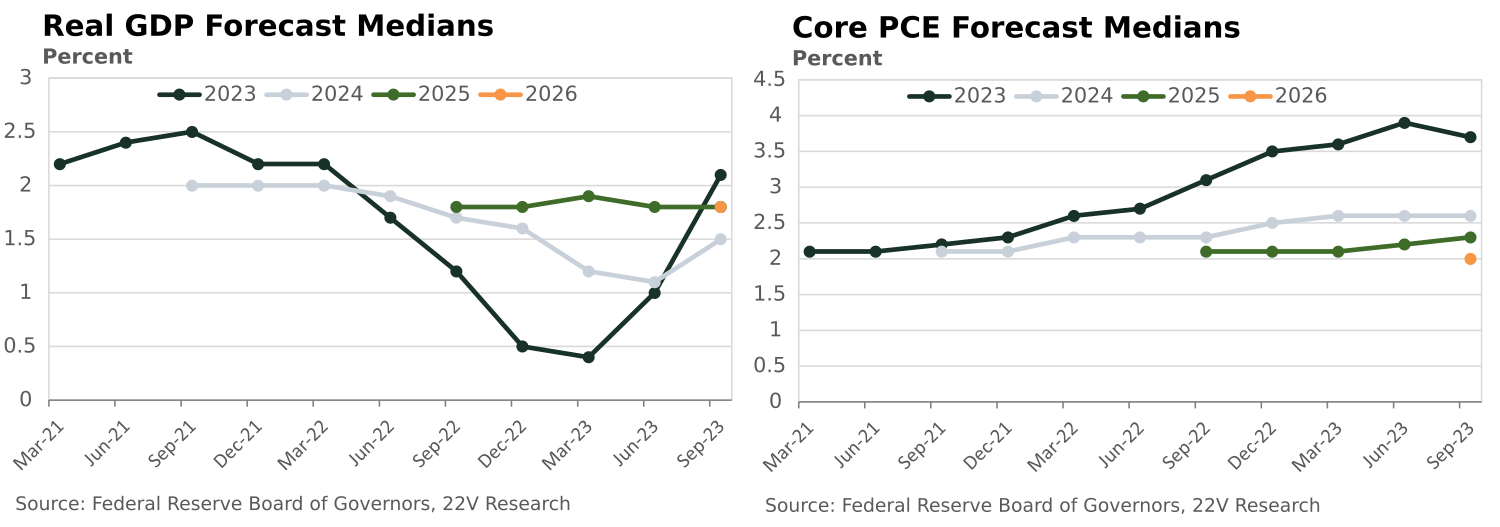
Given that growth relative to trend is the key signal which helps pin down the level of the neutral rate, revisions to growth forecasts (or similarly to the unemployment rate), and the forecast errors they represent, will over time shift the neutral rate in the common model setups. This is particularly relevant now because the recession or recession-lite forecasts which were called for around the turn of the year were generally quite tightly linked to the acceleration in the pace and then boost in the peak terminal rate of the Fed’s rate hiking cycle. Of course, this isn’t to say that an eventual recession might not happen given where real rates are and the Fed projects for them to remain but clearly the initial recessionary impacts of the tightening cycle were overstated relative to many observers’ expectations.
While one can say that shifts beyond monetary policy have been responsible for the economy’s surprising robustness, this is precisely the point: the neutral rate moves around in response to other shocks impacting the economy and gives monetary policy a sense of neutral which incorporates those things it cannot directly control.[5] Often discussions of the drivers of neutral get far too focused on very long-run structural forces but the persistent-but-cyclical seem to be just as important, an underappreciated point.
We can see that for both private sector forecasters and the Fed, after forecasting and implicit mild recession for much of late 2022 and 23H1, growth is now expected to grow much closer to trend over the next year or two.
Theoretically Structured Models
Laubach-Williams is the most commonly cited neutral rate model and remains the benchmark in the field.[6] The FRBNY updates the model and a related one quarterly (after pausing publication during covid to update and tweak it) here. It applies some relatively simple economic theory and structure to the data in order to estimate r*.
However, it has some substantial well-known and less well-known flaws that are worth highlighting.
First among them are the quite wide error bands on the estimates of neutral (which used to be included in the updates posted to the FRBNY’s website but seem to not be any more). Historically the 70th %-ile confidence bands were often more than 1p.p. wide in each direction, which implies 90th%-ile bands of, quite roughly, almost 4p.p. across.
Second, the embedded macro model (an accelerationist Phillips Curve which assumes that inflation is a random walk over the medium-term) is inconsistent with the Fed’s current framework and there is nothing which links the LW neutral estimate to inflation at the 2% target, rather it defines neutral as the level which keeps inflation steady. This link to inflation’s direction rather than its levels in this model setup also suggested that the output gap was positive for the vast majority of the post-financial crisis business cycle; something which strains credulity. The lack of anchoring in this approach is also largely responsible for the difficulties in estimating LW and its wide error bands.[7]
Despite the odd level of the estimated output gap in LW, because the output gaps’ dynamics are what drive the neutral rate more than the level itself, the neutral rate estimates from model seem plausible, although they tend to be subject to notable revisions in real-time use.[8]
Despite its issues, LW’s move up since 2015 is directionally notable even if it is little changed since covid.[9]
There are large number of models which build off the basic approach of LW, often bringing more data or structure to bare on the problem and, usually, attaining more precise and less prone to revision estimates of the neutral rate and output gap.[10]
(Less Structured) Time-series Models
These impose less theoretical structure on the data than do models like Laubach-Williams. These approaches tend to be conceptually simpler but, like all models, require interpretative care as the outputs can, again, be somewhat different from the definitions commonly used by policy makers even if those differences are somewhat subtle at times.
Lubik-Matthes, published by the Federal Reserve Bank of Richmond here, is the most commonly cited model of this type. It uses a set of time-varying parameter regressions to link GDP growth, inflation, and interest rates. The trends of all three series are allowed to vary over time and the evolution of these drives the neutral rate as shown. The neutral rate from Lubik-Matthes isn’t linked to the Fed’s 2% inflation definition either but its model setup, in my view, seems a bit more consistent with the Fed’s general framing.
Like almost any model it has wider uncertainty bands in the post-covid period but, after some volatility, it suggests a notable increase in the neutral rate since 2015 and covid (see chart above).
As someone who thought neutral was closer to 2% pre-covid this is a large revision but not out of keeping with those seen after prior large shocks which are often smoothed through ex post. ↑
Both the green transition and re-regionalization also represent a faster depreciation rate shock for some of the capital stock as well, which should in most models raise neutral. ↑
Technically the vast majority of the models are specified in terms of the output gap or unemployment rate but the logic underpinning the dynamics is the same and just requires some different algebra to tease out. ↑
To quote Chair Powell at Jackson Hole in 2018, “While the unemployment rate is below the Committee’s estimate of the longer-run natural rate [as of Aug 2018], estimates of this rate are quite uncertain. The same is true of estimates of the neutral interest rate. We therefore refer to many indicators when judging the degree of slack in the economy or the degree of accommodation in the current policy stance.” ↑
For example, post-GFC the decline in neutral rate (and to a lesser extent potential GDP growth) can be see as reflecting the impacts of the balance sheet and funding market stresses which hit had long lags.
Excellent research by senior Fed staffer Michael Kiley suggests that after accounting for fiscal policy, corporate bond spreads, and credit growth relative to GDP that the underlying neutral rate only minimally changes over time (look at the gap between the blue and green lines in fig 7). It is exactly these sorts of large and persistent impacting shocks which move around simpler estimates of neutral. ↑
There are also highly structured and theory driven estimates. These models tend to be more one-off research projects or infrequently updated for internal consumption at central banks and other large policy institutions. They are often used to understand the directional impacts of larger or more difficult to intuit issues such as shifts in demographics or patterns of global financial flows. ↑
LW suffers both from a lack of anchoring in inflation but it also brings relatively little data to bear on the question, having more latent to-be-estimated series than key data inputs. ↑
This is a problem made worse by the model’s estimation approach combining with often notably revised GDP data; employment data tends to be more stable in real time use. See this from the FRBNY for more detail; scroll to p.9 for the key chart. ↑
I have a suspicion that the way LW was tweaked to allow it to be estimated during and after covid, itself a somewhat glaring problem in many ways, by introducing covid-lockdown indices into the model is why it shows little movement in r* or potential GDP growth since covid hit. ↑
While at the IMF, two colleagues and I worked on a model which imposed a theoretical structure that linked the model’s estimate of potential growth and the neutral rate to be consistent with inflation at the Fed’s 2% target. We also added in a broader swath of data in order to help more precisely estimate the latent ‘stars’. These choices seemed to make the estimates more robust in real-time use and allowed for a definition of neutral more consistent with the Fed’s operating framework. ↑

