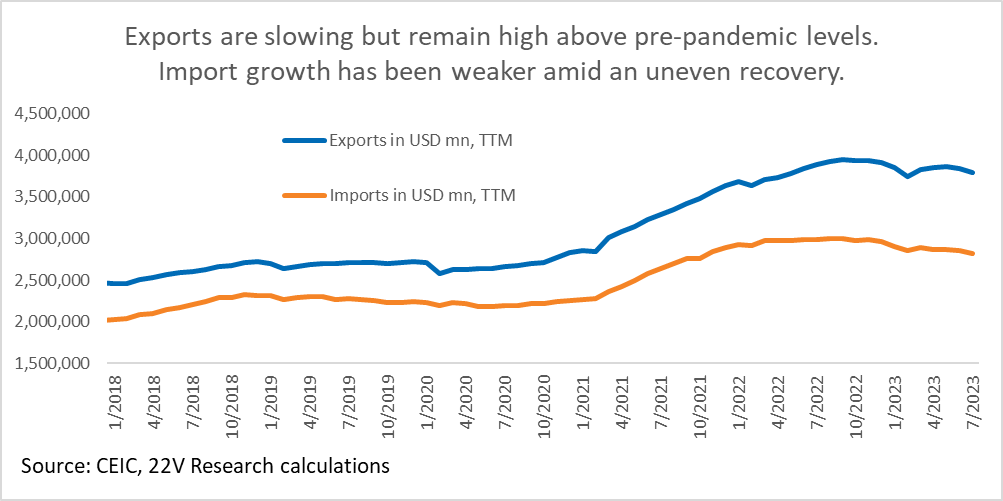
China’s exports and imports for July both missed expectations. Export growth in USD terms came in at -14.5% y/y (vs. -12.4% y/y in June) while import growth in USD terms was -12.4% y/y (vs. -6.4% y/y in June).
One should not sugarcoat the data. Slowing exports are hitting a key growth engine for China (20% of GDP) and will also act as a headwind for manufacturing investment. Weak import growth reflects soft domestic demand amid a very gradual, services-driven recovery.
That said, it is important to point out that base, price and currency effects make the data look even worse than the underlying situation:
- Base effects: in July 2022, Shanghai had emerged from lockdown and supply chains were becoming unclogged, leading to a surge in both exports and imports. If one strips out the y/y base effect by looking at July 2023 growth over July 2021 growth, the deceleration in exports is less pronounced: two-year export growth was 0.2% in July compared to 1.8% in June. But the same approach doesn’t do much to flatter imports: two-year import growth was -11.2% in July compared to -7% in June. Stepping back, China’s exports have fallen in recent months but levels remain well above where they were before the pandemic. That is not true of imports, reflecting the uneven post-Covid recovery.
- Currency effects: It generally makes sense to examine China’s trade data in USD terms if one is looking at the global context (including comparison with other trade partners). However, looking at the values in RMB terms can be useful for a sense as to how dynamics are playing out in China’s domestic economy. Because the RMB has been depreciating, the trade data looks a bit better in RMB terms: exports in RMB fell by -9.2% y/y in July (from -8.3% in June) while imports in RMB fell by -6.9% y/y compared to -2.6% in June. That is, export proceeds (repatriated into RMB) aren’t being hit quite as hard, and import demand isn’t quite as weak as the headline USD figures would suggest.
- Commodity price effects: China doesn’t provide a detailed breakdown of imports in value terms but does provide this data for basic commodities. The takeaway is that commodity demand for China slowed in July but far from precipitously. While the value of crude imports fell by -20.8% y/y (vs. -1.4% y/y in June) in volume terms it slowed from a blistering 45.3% y/y in June to a still healthy 17% y/y in July. As 22V’s commodities head Colin Fenton wrote in a note today (link HERE), “China’s imports of crude oil downshifted from ‘very hot’ to ‘near trend’ in July,” which is not surprising and “leaves the bull case for crude intact.” Iron ore imports were less robust but also show a strong price effect: the value of imports fell -14.9% y/y in July, while in volume terms imports slowed to 2.4% y/y (from 7.4% in June). (See HERE for Colin’s take yesterday on recent declines in China’s iron ore futures prices.)
One should also view China’s forthcoming inflation data (to be released tonight at 930pm ET) in the context of base and commodity price effects. Forecasts call for headline CPI to turn negative y/y this month, but this partly reflects a fall in food prices, which surged last summer amid the Ukraine conflict. Most analysts expect CPI to turn positive later in the year. PPI, on the other hand, has already been in deflation though forecasts expect the year-over-year decline to have narrowed in July due to rising global commodity prices. The fact that both consumer and producer price growth will likely be negative in July will spur further concerns and the narrative over whether China’s faces entrenched deflation and the potential for a vicious cycle that impacts real demand (consumers slowing purchases, real debt burdens rising, etc.). This concern is probably overstated or at least premature, at least on the consumer side; consumption since the end of zero-Covid has been decent but not so strong yet as to keep up with the increase in supply, which didn’t suffer as much damage during the pandemic. On the industrial side, deflation does strengthen the case of those in China who argue that monetary policy should loosen further to offset a rise in real borrowing costs (see our recent China trip report HERE).
Summing up, our view remains that Beijing’s targeted stimulus policies are insufficient, when set against stiff economic headwinds, to quickly strengthen and broaden the anemic recovery underway (see our Friday update on the policy reaction function HERE). Policymakers will likely do just enough to meet the 5% annual GDP growth target, though this is not guaranteed. It will be important to examine the bevy of July activity data that comes out on Monday evening (10pm ET) and to look past the base effects. If the data are soft but not terrible, which seems like a reasonable assumption, Beijing will maintain the incremental rollout of narrow measures now underway. Indications that even the 5% growth target is in jeopardy will spur stepped-up measures but still mostly targeted and not the proverbial ‘bazooka’.
In some ways the more important development this week is not the economic data but news that property developer Country Garden missed a payment on a US dollar bond and appears headed for default. The ongoing financing difficulties of developers will hurt already weak sentiment in the property sector and further restrain developers’ acquisition of land. That, in turn, will exacerbate strains for local governments and their affiliated entities, who rely on land sales for revenue and loan collateral. The 24 July Politburo meeting signaled easing in the property sector, but seemingly not at a pace or scale to offset its challenges.