

The idea that monetary policy hits the economy with a long lag is sensible and firmly established by analysts with greater expertise than I have. But there are a few points that are important to keep in mind when applying the idea:
- There is a long lag from changes of financial conditions (which is what people mean by monetary policy in this context) to the full effects on inflation. The lag to the majority effect on growth is much shorter. If, in the wake of a monetary tightening, growth starts to reaccelerate before inflation is fully affected according to the model, then the model is likely to mislead in real time application.
- Financial conditions are affected by the expected path of the funds rate much more so than its actual level. Accordingly, we need to start the clock measuring when the Fed tightening began to when expectations moved. And in this episode, that consideration is particularly important because the Fed’s pretense of not raising the funds rate until the conditions set out in the September 2020 conditional rates guidance were met created a huge gap between when expectations changed and the funds rate itself changed. (A nasty way to put this is that the Fed stealth reneged on the guidance, as I have been over in earlier notes.)
- In addition, there is slippage from even the expected path of the funds rate and broader financial conditions, reflecting factors external to the Fed’s guidance, when they are guiding. And it is pointless, in practical application, to measure this slippage. Instead, we can just look at financial conditions, the inputs to which are available to us in real time on the screens. How to weight those inputs is a lively debate, but it does not intrude on the point I am making here.
- Finally, even the impetus from financial conditions – even properly measured — to the real economy growth rate can be cross-checked against developments in the real economy. For example, if sectors that are meant to be particularly sensitive to financial conditions are showing signs of recovery in the long wake of a tightening, that might be evidence that the peak effects on growth are in.

Source: BEA, Federal Reserve Bank of Atlanta GDPNow
Data are actual to Q1 and estimated to Q2.
So, the idea that there are lags from the funds rate to the overall economy can be both true in the abstract and yet not particularly helpful in real time application, given the considerations listed above. I mention this because mortgage yields are down slightly from their peak ten months ago and the data from the housing sector is suggesting that the effects on aggregate demand growth are probably now mostly in. With the housing construction and existing home sales data now printed for June, I figured it might be a good time to update some of the metrics associated with this take.
Let’s start with the simplest summary measure, presented in the chart above. The direct drag on aggregate demand growth from falling residential investment has declined from a staggering 1.6 percentage points (ar) in the third quarter of last year to 0.0 as of the second quarter. (The second quarter estimate is from the Atlanta Fed’s GDP bean count updated post the housing starts numbers. But that figure is pretty close to my own. It is hard to depict 0 on a bar chart, so I use the blue circle.) I had expected this development, but it has come more quickly than I forecast.
It seems unlikely that housing will emerge as a significant tailwind behind growth going forward. There are two reasons for that, one of which is obvious and probably not incremental, and the other of which is a bit more interesting. The “easy” reason is that the Fed would not likely tolerate it, barring a major drag from some other sector in the economy. If the most interest sensitive sector starts providing a tailwind, then the Fed will just tighten more than I expect. The more interesting reason relates to the fact that housing is probably not inclined to shift to a major source of growth with mortgage yields near here.
Source: Federal Reserve Bank of St. Louis (FRED)
Data are actual to June.
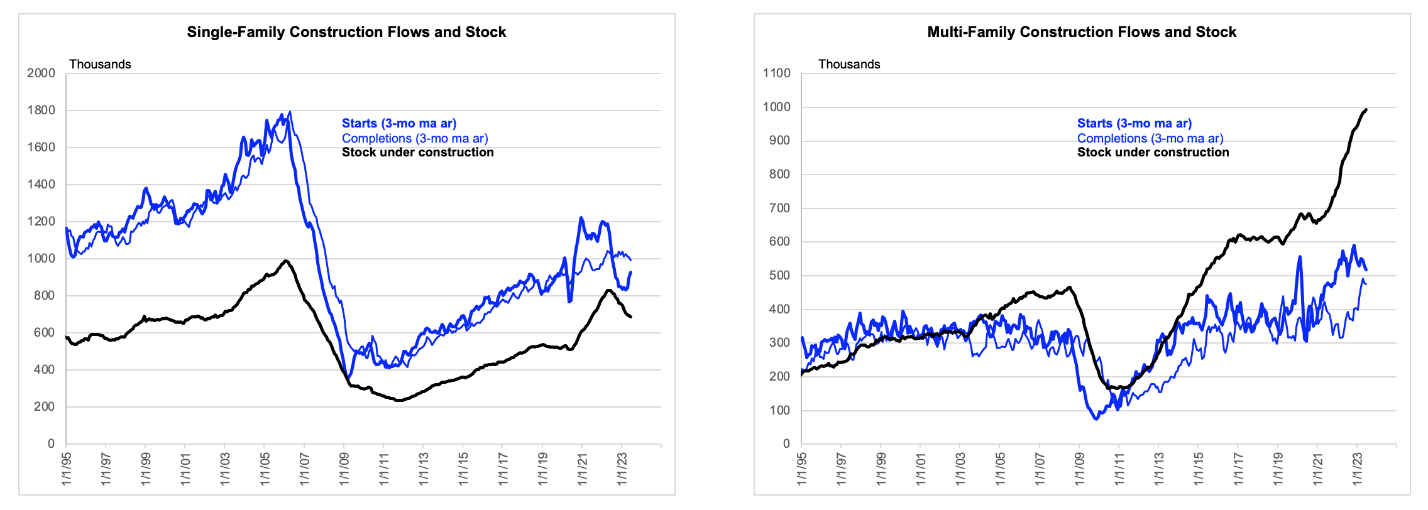
One reason for this is that the multifamily sector is levitating and due for a huge contraction, once the current pipeline of projects is burned through and the effect of tighter credit (and presumably a reduced financial incentive to build) begins to take effect. I am not particularly expert on this issue, but the chart above gives a sense of the basic issue. I would just point out that this is a likely headwind, rather than a source of a major shock. As of the first quarter, multi-family residential investment was just 38 basis points of GDP, i.e., just over 1/3 of one percent. If this sector were to fall 50% over the span of a year, the 4-q hit to GDP growth would be less than 20 bps. But it will not be a source of strength.
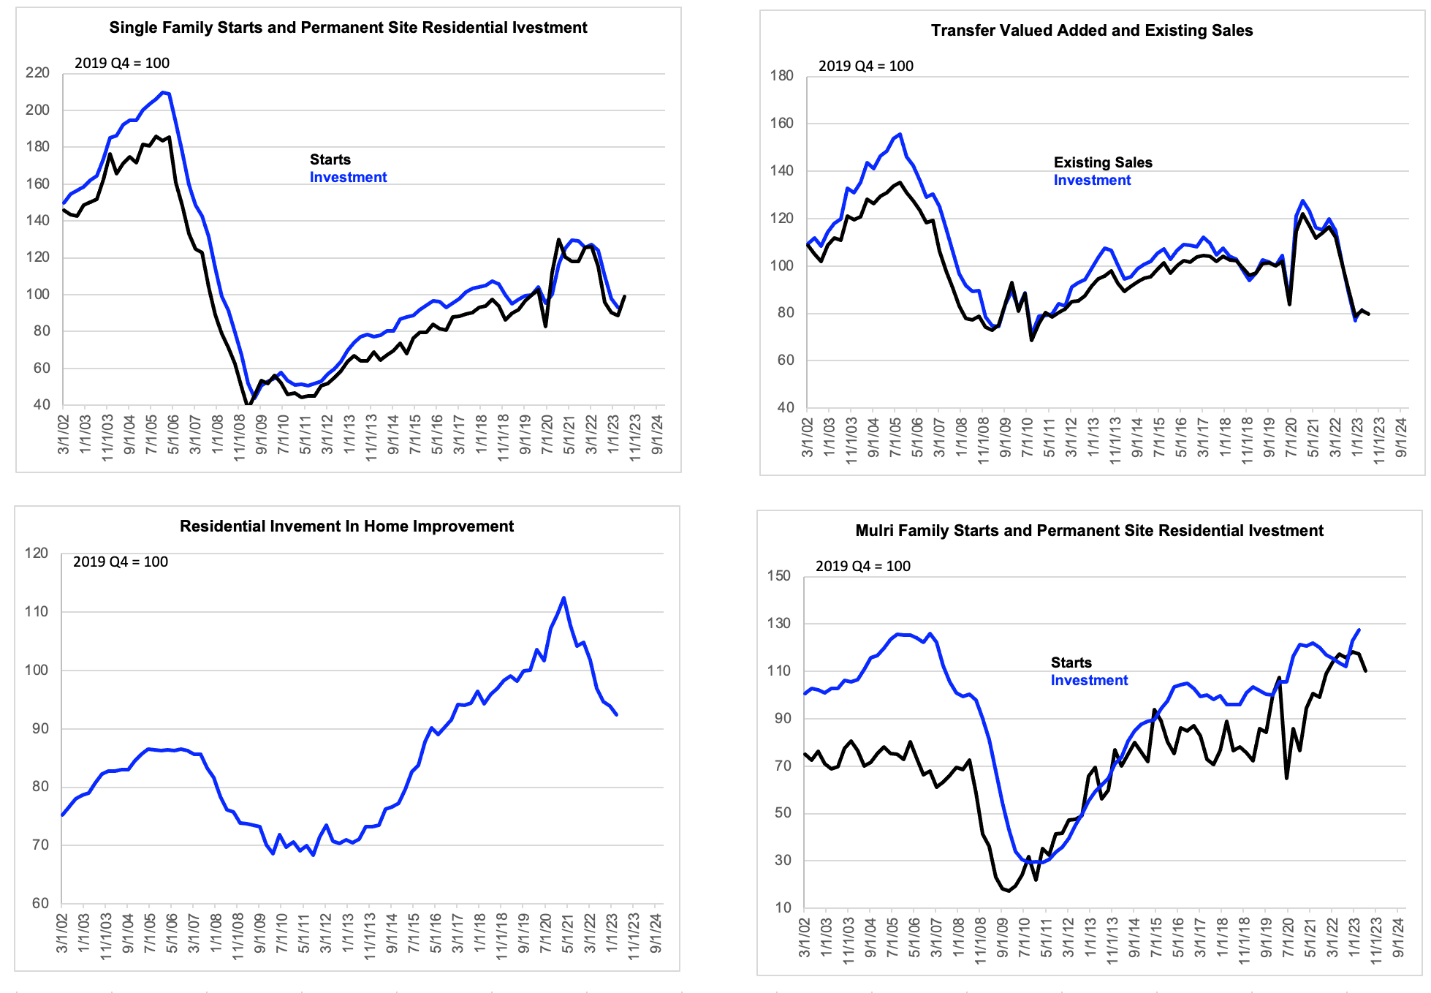
By far, the more important components of residential investment are (in descending order) single-family new construction, home improvement, and marketing value added from turnover. These range from almost four times as important as multifamily to almost two times. And the total is just under 4% of GDP. Let me quickly run through what seems to be the setup here in point form:
- The recovery of housing starts to Q2 (now in the official data) suggests that the decline in this sector is behind us. However, there would seem to be little prospect for a strong recovery here given the lack of tailwind from falling mortgage yields and the fact that starts are slightly – not dramatically – below what is implied by demographic trends.
- Home improvement spending appears still to be in a downtrend. Sorry if this “technical” analysis of the sector seems a bit thin gruel, but it is what I have.
- The set-up for marketing value-added seems similar to that for single-family construction, very unsurprisingly, as they tend to be driven by similar fundamentals. The stabilization of existing sales means the earlier headwind is unlikely to return soon, but a big impetus from this source also seems unlikely.
The more important point is that the huge headwind from a few quarters ago has gone away. And that is a serious problem for those looking for the lagged effects of monetary tightening suddenly to take down aggregate demand growth.
Source: BEA, Federal Reserve Bank of St. Louis (FRED), FH calculations
Residential investment figures shown in blue are actual to Q1 only with no estimates. Proxies shown in black are actual to Q2 and recently updated.

