Back Portfolio Strategy

Destocking Rebound Thesis Playing Out + Tech Earnings Caution

Published on July 20, 2023

∙ Download the PDF Report

By

Dennis DeBusschere

Brian Herlihy

Kevin Brocks

Sophia Wang

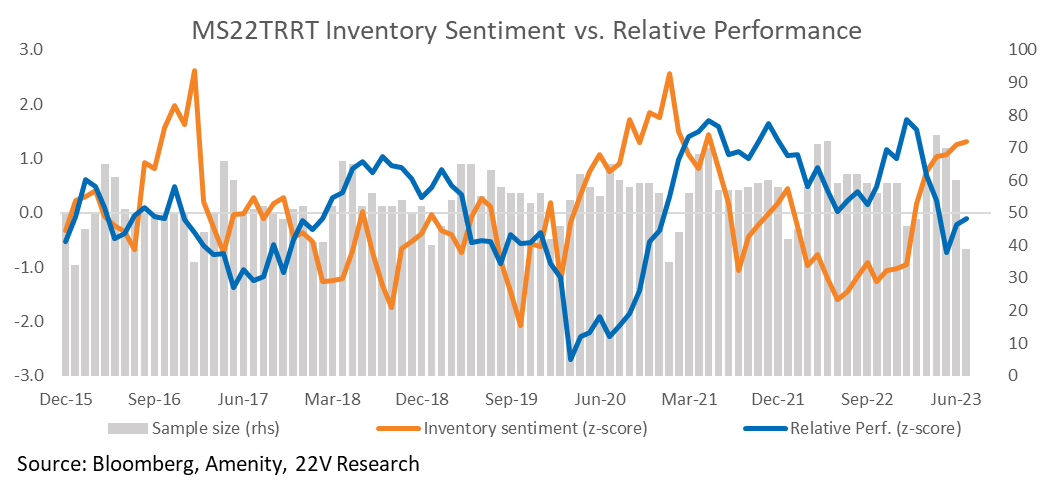
SUMMARY: Our destocking reversal portfolios, which are comprised of retail and trucking names, both outperformed the S&P by over +1pp yesterday and we expect the outperformance to continue. Even with the Fed continuing to deliver below-trend growth for an extended period, companies will start to order more goods, especially given the decline in inventories, unless the economy falls into a recession. Bottom line, the conditions are still in place for the destocking reversal trade to work – the group is relatively inexpensive, inventory sentiment for retail/trucking names has improved (we measure inventory sentiment using the Amenity natural language processing tool) and outpaced equity performance, and personal consumption expenditure growth is currently tracking above 2%. Earnings continue to point to low recession odds as well.

The destocking portfolio gained yesterday following JB Hunt earnings. JB Hunt missed revenue and EPS, but management made some comments about the end of the trucking recession being near. This is the narrative that we want to capture with our portfolios. Growth is not strong, but the destocking ahead of a presumed recession still needs to be unwound. Constituents of our Destocking portfolios are at the end of this report.

TECH EARNINGS CAUTION: In our DN yesterday, we highlighted our S&P earnings beat vs miss baskets (HERE). The current sector composition of our baskets (long beat basket, short miss basket) is more Health Care and Discretionary than normal, and less Communication Services, Tech, and Financials.

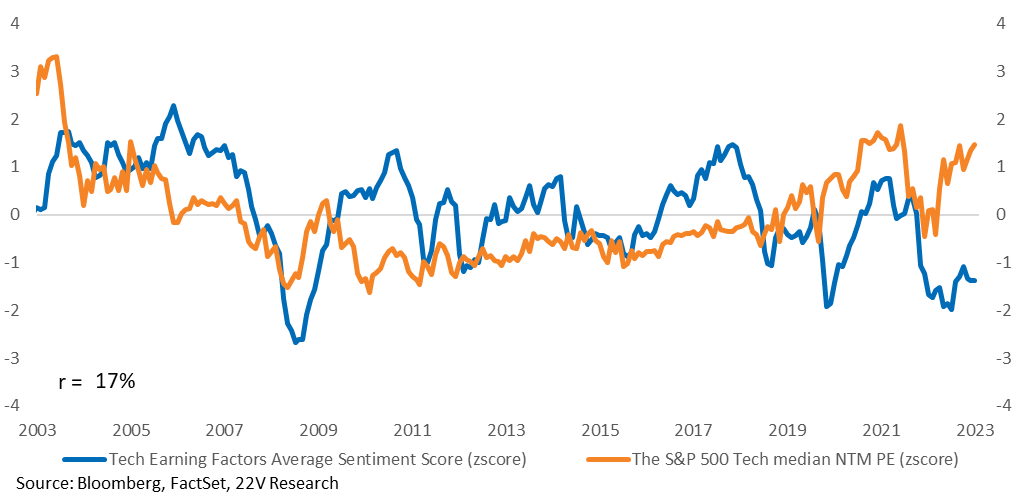
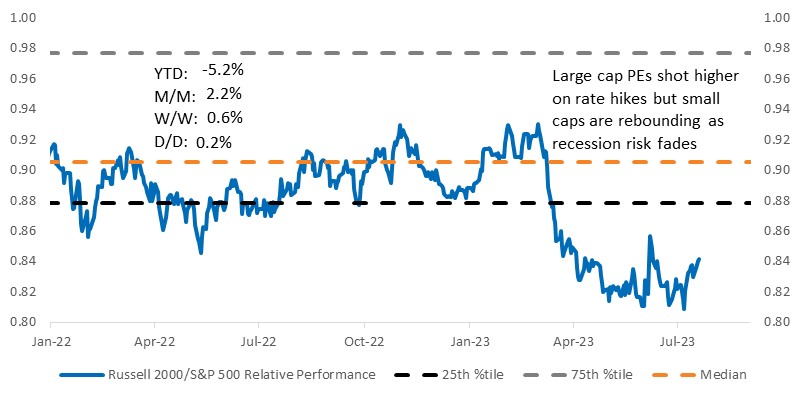
Tech PEs have taken off while earnings sentiment has deteriorated. We wouldn’t short Tech; we prefer the sector on a longer-term outlook because it is Quality Growth in an economic backdrop of below-trend demand growth coupled with strong idiosyncratic themes (idio is a focus now that correlations are breaking down, more HERE). But earnings may be a near-term headwind and we continue to favor the average stock over the mega caps given the massive run in mega caps on recession/credit/consumer fears. Small caps have been outperforming. The plural of anecdote is NOT data, but TSMC is a drag on futures after missing margin estimates and guiding lower (HERE).
A graph of blue and orange lines

Description automatically generated

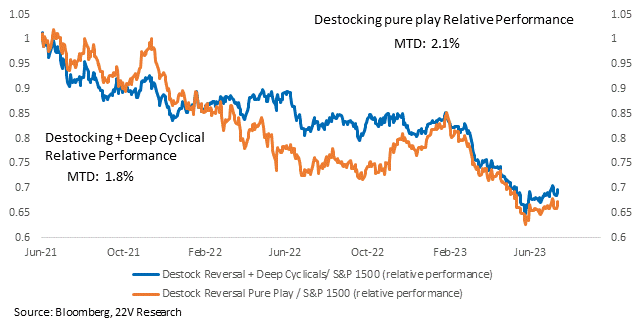
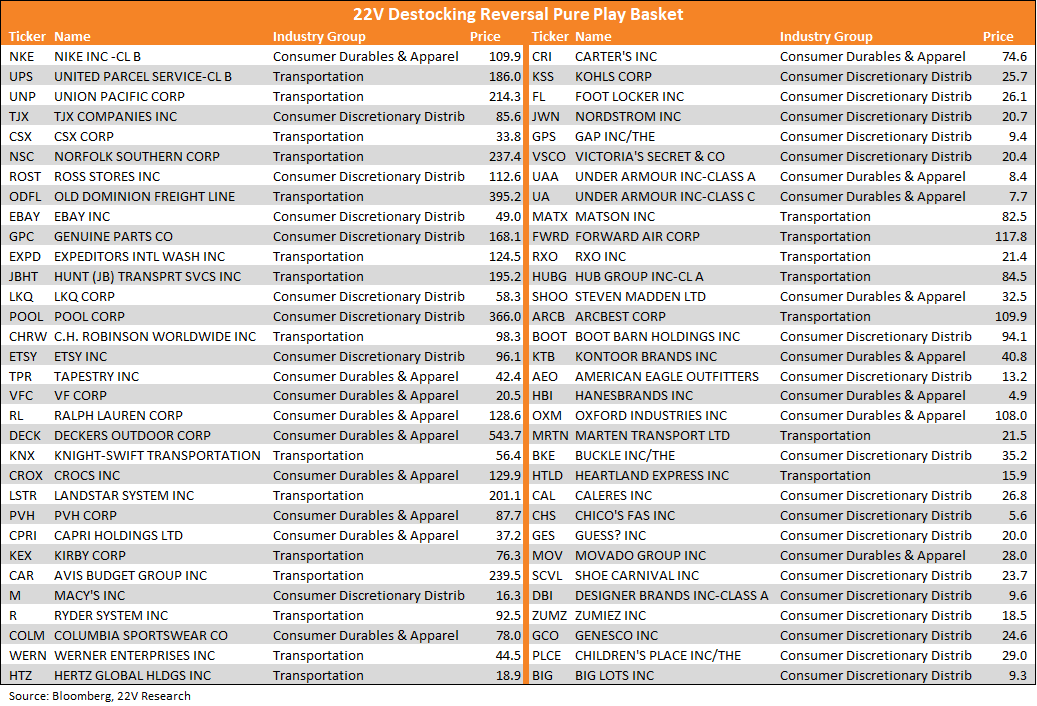
MARKET VIEWS: Our destocking reversal portfolios both outperformed the S&P by over +1pp yesterday (Retail and Transports had strong days). The portfolio enjoyed a tailwind from the commentary around JB Hunt earnings. JB Hunt missed on revenue ($3.13B vs $3.28B est) and EPS ($1.81 vs $2.42 est) but beat on intermodal volume (501,681 loads vs 500,949 est). A flood of analysts gave constructive commentary about how well positioned JBN Hunt is for the trucking demand rebound, which the beat in volume may suggest is here (HERE). This is the narrative that we want to capture with our portfolios. Constituents are listed at the end of this report.
A graph of a stock market

Description automatically generated

As Gerard mentioned on Tuesday, real Personal Consumption Expenditure Growth (PCE) growth looks to be tracking in the 2-2.5% range (HERE). Bottom line, the conditions are still in place for the destocking reversal trade – the group is relatively inexpensive, inventory sentiment (we measure this using the Amenity Natural Language Processing tool) has outpaced equity performance, and economic expectations were poor – but this is a tactical trade, not a long-term theme.
A graph of blue and orange lines

Description automatically generated

TECH EARNINGS CAUTION: In our DN yesterday, we highlighted our S&P earnings beat vs miss baskets (HERE). The current sector composition of our baskets (long beat basket, short miss basket) is more Health Care and Discretionary than normal, and less Communication Services, Tech, and Financials.
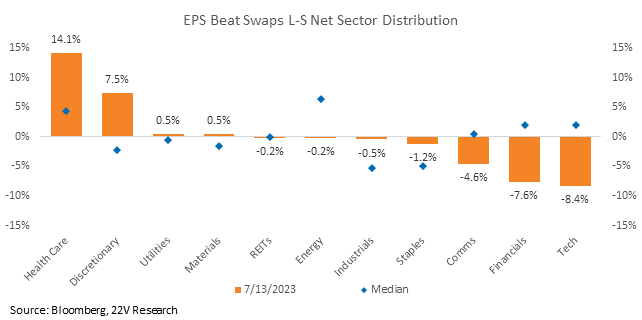
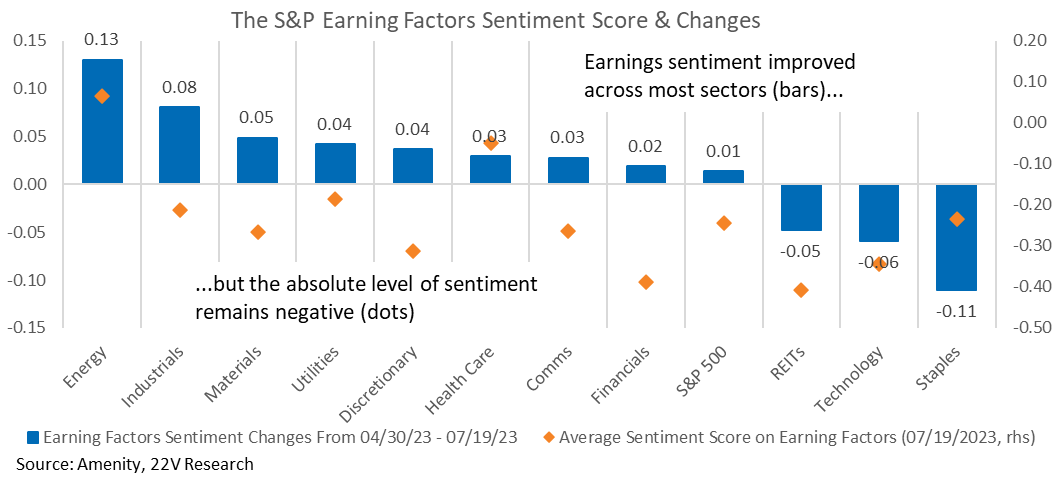
Health Care (the entire sector) has the second highest earnings sentiment score. Discretionary earnings sentiment is much worse on an absolute level but has improved, which is the narrative the market has seemed to embrace as recession expectations are again pushed out. Tech’s sentiment has gotten worse q/q.
A graph of blue squares and orange dots

Description automatically generated

Tech PEs have taken off while earnings sentiment has deteriorated. We wouldn’t short Tech; we prefer the sector on a longer-term outlook because the sector is Quality Growth in an economic backdrop of below-trend demand growth coupled with strong idiosyncratic themes (idio is a focus now that correlations are breaking down, more HERE). But earnings may be a near-term headwind. Anecdotes != data but TSMC is a drag on futures this morning after missing on margins and guiding lower (HERE).

A graph of blue and orange lines

Description automatically generated

Tech tends to be larger cap as well, and we continue to prefer the average stock. Large/Mega caps benefitted from expectations of a consumer slowdown and credit crunch after bank failures in 1Q. That was a very reasonable fear, but broad economic data, management sentiment, and profitability trends all suggest the economy has absorbed rate hikes without collapsing. Recession risk remains elevated but is 1) lower than it was a few quarters ago, and 2) nearby deep recession risk is MUCH lower. Expect the average stock, risk-on factors, and Cyclicals to continue to lead unless inflation remains too high (causing the Fed to re-tighten financial conditions).

Source: Bloomberg, 22V Research
Pure play destocking reversal here…
A table with text on it

Description automatically generated

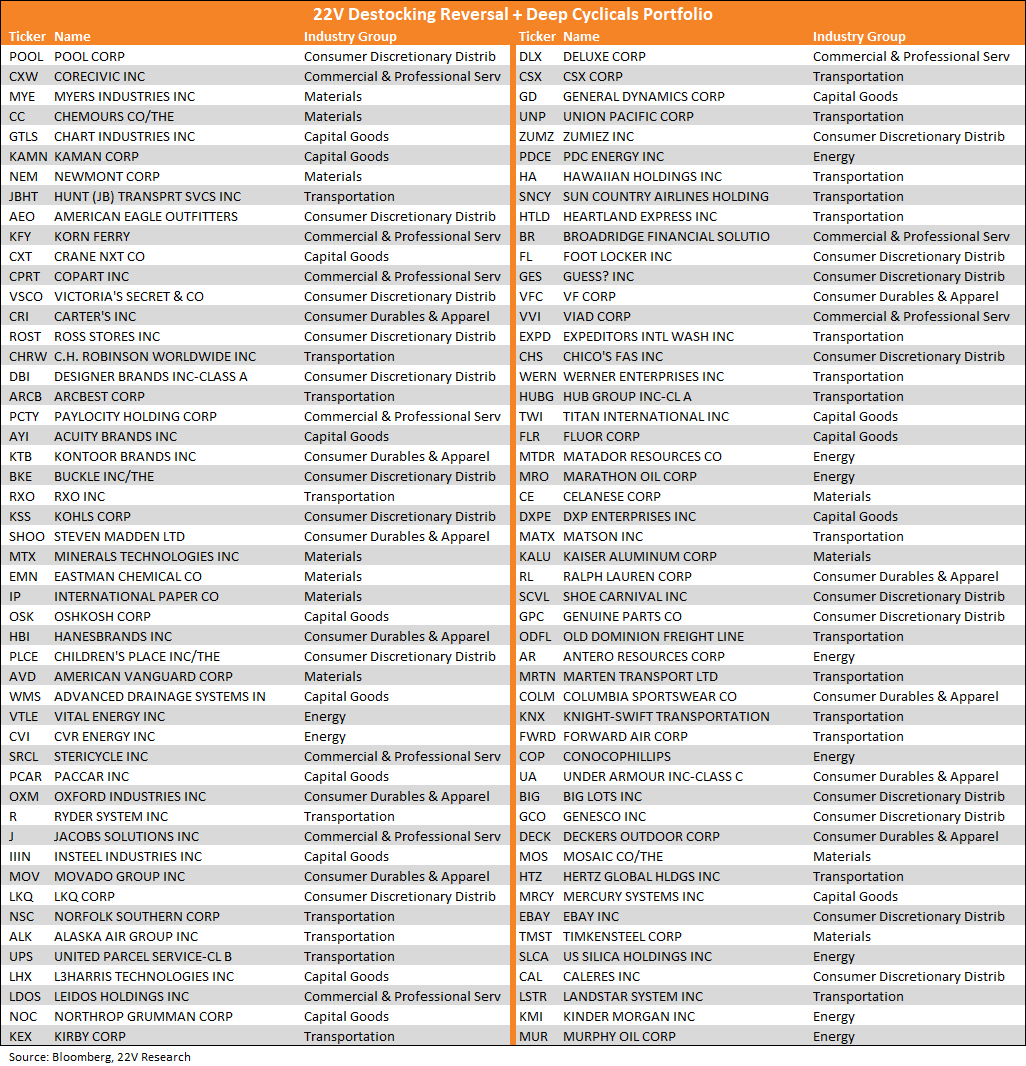
Blended with other Deep Cyclicals to round out a better balanced basket here…
A table with text on it

Description automatically generated

DISCLOSURES AND DISCLAIMERS

Analyst Certification

The analyst, 22V Research Group, primarily responsible for the preparation of this research report attests to the following: (1) that the views and opinions rendered in this research report reflect his or her personal views about the subject companies or issuers; and (2) that no part of the research analyst’s compensation was, is, or will be directly related to the specific recommendations or views in this research report.

Analyst Certifications and Independence of Research.

Each of the 22V Research analysts whose names appear on the front page of this report hereby certify that all the views expressed in this Report accurately reflect our personal views about any and all of the subject securities or issuers and that no part of our compensation was, is, or will be, directly or indirectly, related to the specific recommendations or views of in this Report.

22V Research (the “Company”) is an independent research provider. The Company is not a member of the FINRA or the SIPC and is not a registered broker dealer or investment adviser. 22V Research has no other regulated or unregulated business activities which conflict with its provision of independent research.

22V Research, LLC is a professional services and independent publication organization. 22V Research, LLC is not a securities broker-dealer, not a member of the Financial Industry Regulatory Authority (FINRA), not a registered investment advisor (RIA) and not a member of SIPC.

Securities transactions, when offered, are offered by 22V Securities, LLC through LPS Capital, LLC. Certain employees of 22V Securities, LLC are dually registered as securities representatives of LPS Capital, LLC or Analyst Hub Securities, LLC. 22V Securities, LPS Capital and Analyst Hub Securities are members FINRA, SIPC.

https://brokercheck.finra.org/

Current Ratings Definition.

SECTOR OUTPERFORM: An “outperform” rating anticipates the company will outperform the S&P Regional Banking Index (peer group).

SECTOR PERFORM: A “market perform” rating anticipates the company will perform in line with the S&P Regional Banking Index (peer group).

SECTOR UNDERPERFORM: An “underperform” rating anticipates the company will underperform the S&P Regional Banking Index (peer group).

Limitation Of Research And Information.

This Report has been prepared for distribution to only qualified institutional or professional clients of 22V Research Group. The contents of this Report represent the views, opinions, and analyses of its authors. The information contained herein does not constitute financial, legal, tax or any other advice. All third-party data presented herein were obtained from publicly available sources which are believed to be reliable; however, the Company makes no warranty, express or implied, concerning the accuracy or completeness of such information. In no event shall the Company be responsible or liable for the correctness of, or update to, any such material or for any damage or lost opportunities resulting from use of this data. Nothing contained in this Report or any distribution by the Company should be construed as any offer to sell, or any solicitation of an offer to buy, any security or investment. Any research or other material received should not be construed as individualized investment advice. Investment decisions should be made as part of an overall portfolio strategy and you should consult with a professional financial advisor, legal and tax advisor prior to making any investment decision. 22V Research Group shall not be liable for any direct or indirect, incidental or consequential loss or damage (including loss of profits, revenue or goodwill) arising from any investment decisions based on information or research obtained from 22V Research Group.

Reproduction And Distribution Strictly Prohibited.

No user of this Report may reproduce, modify, copy, distribute, sell, resell, transmit, transfer, license, assign or publish the Report itself or any information contained therein. Notwithstanding the foregoing, clients with access to working models are permitted to alter or modify the information contained therein, provided that it is solely for such client’s own use. This Report is not intended to be available or distributed for any purpose that would be deemed unlawful or otherwise prohibited by any local, state, national or international laws or regulations or would otherwise subject the Company to registration or regulation of any kind within such jurisdiction.

Copyrights, Trademarks, Intellectual Property.

22V Research Group, and any logos or marks included in this Report are proprietary materials. The use of such terms and logos and marks without the express written consent of 22V Research Group is strictly prohibited. The copyright in the pages or in the screens of the Report, and in the information and material therein, is proprietary material owned by 22V Research Group unless otherwise indicated. The unauthorized use of any material on this Report may violate numerous statutes, regulations and laws, including, but not limited to, copyright, trademark, trade secret or patent laws.
