Back Portfolio Strategy

Data Trends Support Continued Rebound in Deep Cyclicals and Destocking Names

Published on July 11, 2023

∙ Download the PDF Report

By

Dennis DeBusschere

Brian Herlihy

Kevin Brocks

Sophia Wang

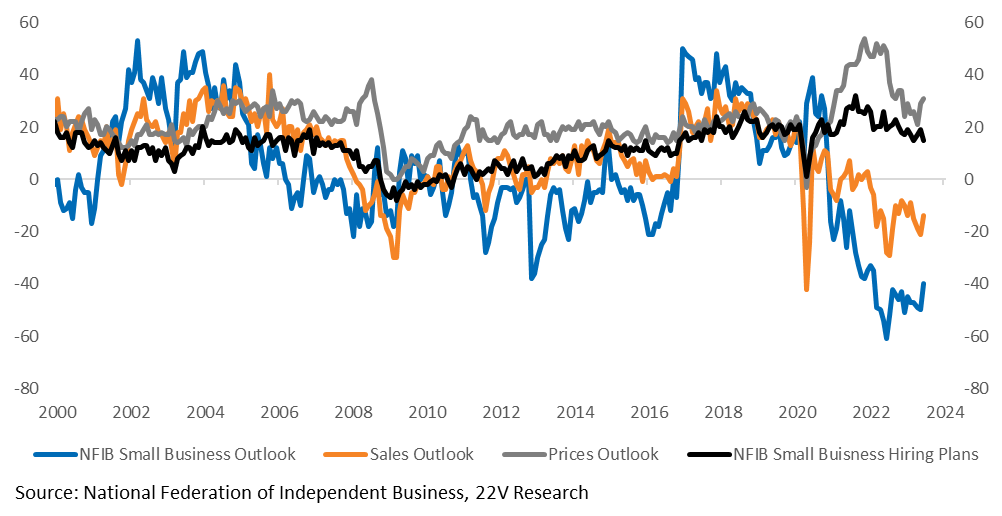
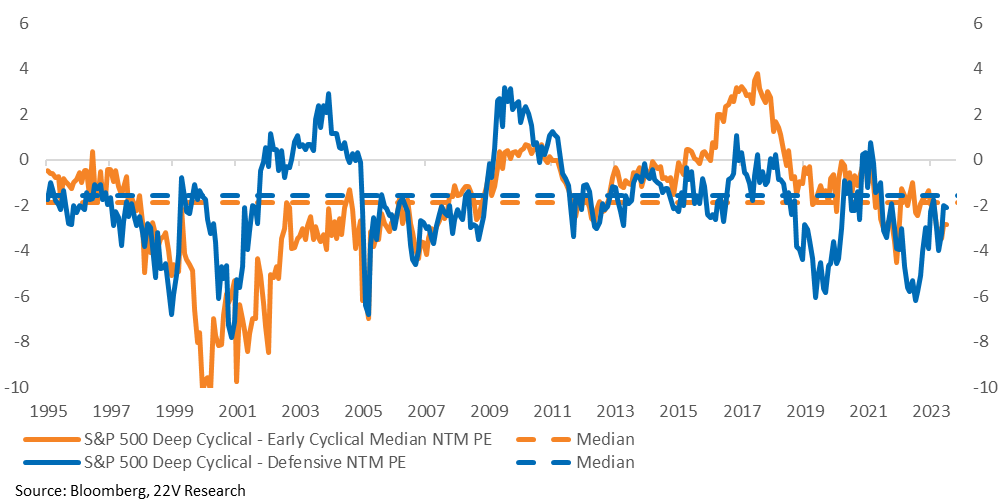
SUMMARY: The NFIB this morning was consistent with the good and the bad parts of the broader economic backdrop; labor is loosening a bit, and business and sales outlooks are firming up a bit, but the outlook for prices remains a risk. For now, firming expectations support a continuation of the Cyclical rebound that has taken hold over the past two months, and the Deep Cyclical recovery over the past month. In 1Q, Deep Cyclicals were priced for a recession and began recovering in 2Q as nearby recession odds fell. Deep Cyclicals are still trading at a discount to Defensives and Early Cyclicals and should continue recovering near-term.

A graph of blue and orange lines

Description automatically generated

Despite the improvement in economic data and lower recession odds (HERE) economic uncertainty remains high, and the Fed needs to keep growth below trend to ease inflation. That makes a directional market call, from current levels, difficult and favors internal rotations. The S&P was up +25bps but Deep Cyclicals outperformed. Our destocking reversal baskets (HERE) were up over 1%.

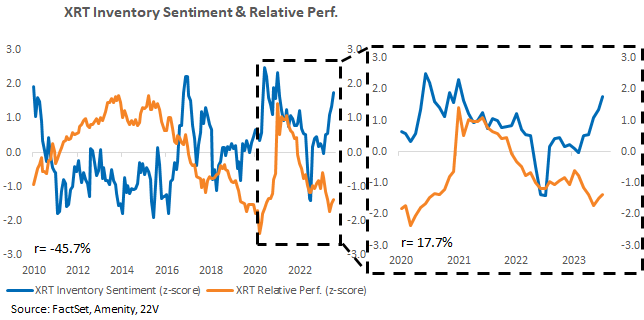
MORE DEEP CYCLICAL INVENTORY SENTIMENT: One reason we have a destock reversal trade on is that inventory sentiment, measured using the Amenity natural language processor, has improved. If we isolate the post-COVID period, when inventory concerns became a much larger issue for companies, inventory sentiment and XRT relative performance have moved together. Management sentiment is an important signal and one that is not likely being tracked/discounted to the same degree as traditional factors or more widespread alternative data.

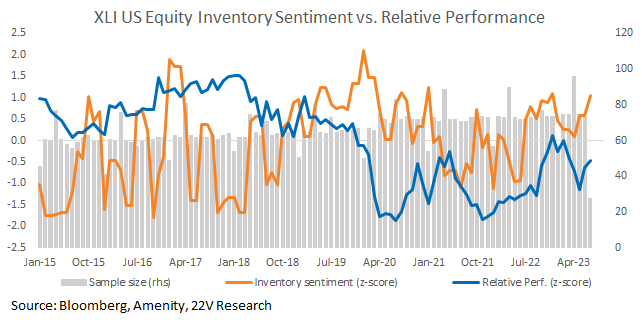
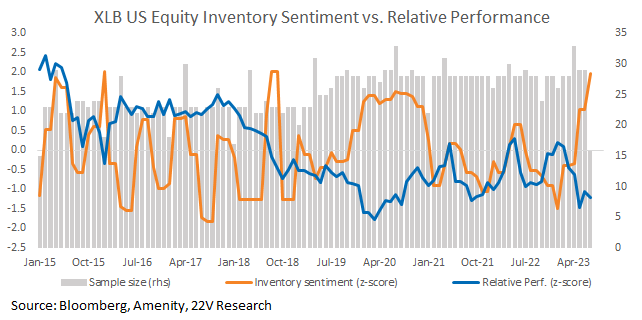
A pattern similar to XRT has developed in XLI and XLB. Management teams in both industries are much more optimistic about their inventories and equity performance has lagged. Fading inventory headwinds are a support for Deep Cyclicals generally.

John Roque likes Industrials here. Charts on the sector, constituents, and Industrials relative to Tech are highlighted HERE and in the full report below…

MARKET VIEWS: Data overnight was consistent with the overall global economic backdrop. CPI readings in Europe were in-line with expectations, which is good, but still over 6%, highlighting the need for policy rates to stay higher for longer. In the US, the NFIB was a good microcosm of the broader economy; labor is loosening a bit, and the business and sales outlook is firming up a bit, but the outlook for prices remains too high.
A graph of sales and outlook

Description automatically generated

For now, that supports a deep Cyclical rebound, because Deep Cyclicals are still priced for worse economic outcomes (PE spreads still below long-term medians). Yesterday’s market action was what we are looking for. The S&P was up only +25bps but Deep Cyclicals outperformed. Our destocking reversal baskets (HERE) were up over 1%.
A graph of blue and orange lines

Description automatically generated

MORE DEEP CYCLICAL INVENTORY SENTIMENT: One of the reasons we have a destock reversal trade on is that inventory sentiment, measured using the Amenity natural language processor, has improved. If we isolate the post-COVID period, when inventory concerns became a much bigger issue for companies, inventory sentiment and XRT relative performance moved together. Management sentiment is an important signal and one that is not likely being tracked/discounted to the same degree as traditional factors or more widespread alternative data.
A graph of blue and orange lines

Description automatically generated

A pattern similar to XRT has developed in XLI and XLB. Management teams in both industries are much more optimistic about their inventories and equity performance has lagged. Inventory headwinds fading are a support for Deep Cyclicals generally.
A graph of a stock market

Description automatically generated
A graph of a line graph

Description automatically generated

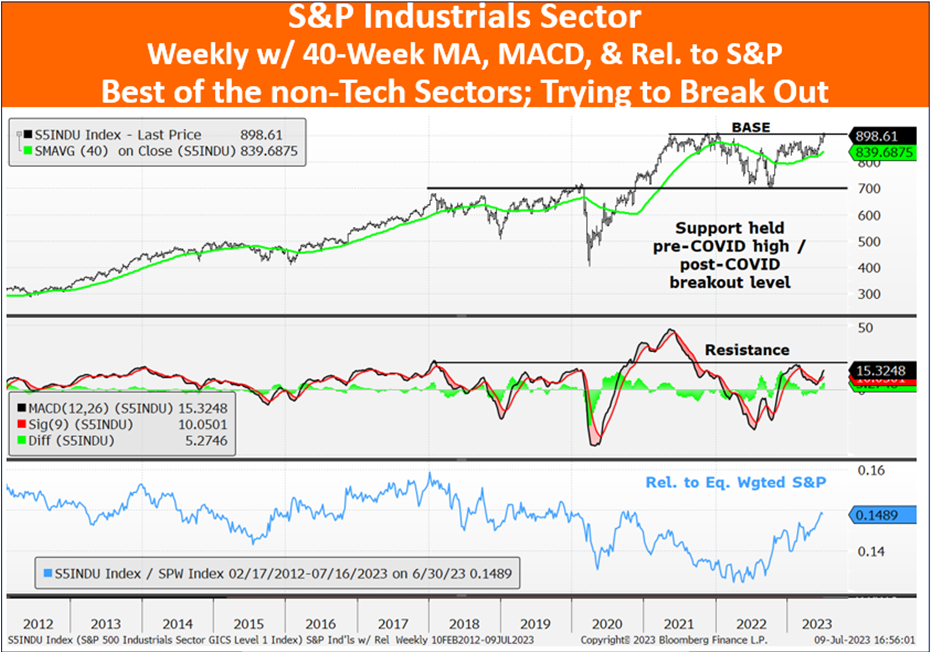
John Roque likes the look of Industrials here. He is flagging (HERE) “The Industrial Sector is the best of the non-Tech Sectors and is trying to break out. It’d be strange to see a breakout for the Industrials while the market / Big 7 pull back, but the Industrials – and the market, too – will get the benefit of the doubt unless this Sector comes under serious pressure. And the Industrials deserve the benefit of the doubt owing to the solid number of BASES among its members.”
A graph of stock market trends

Description automatically generated

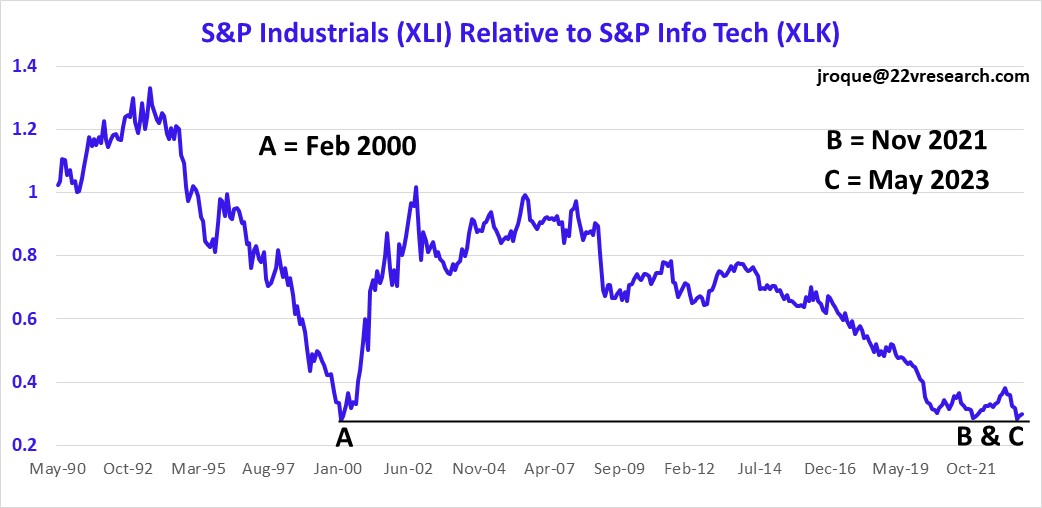
John thinks Industrials relative to Tech is interesting here too, consistent with our call. John adds “it’s seductive and tantalizing to think that this Industrials > Tech rally could be starting from the same level as seen in February 2000.”
A graph with a line graph

Description automatically generated

Source: Bloomberg, 22V Research

DISCLOSURES AND DISCLAIMERS

Analyst Certification

The analyst, 22V Research Group, primarily responsible for the preparation of this research report attests to the following: (1) that the views and opinions rendered in this research report reflect his or her personal views about the subject companies or issuers; and (2) that no part of the research analyst’s compensation was, is, or will be directly related to the specific recommendations or views in this research report.

Analyst Certifications and Independence of Research.

Each of the 22V Research analysts whose names appear on the front page of this report hereby certify that all the views expressed in this Report accurately reflect our personal views about any and all of the subject securities or issuers and that no part of our compensation was, is, or will be, directly or indirectly, related to the specific recommendations or views of in this Report.

22V Research (the “Company”) is an independent research provider. The Company is not a member of the FINRA or the SIPC and is not a registered broker dealer or investment adviser. 22V Research has no other regulated or unregulated business activities which conflict with its provision of independent research.

22V Research, LLC is a professional services and independent publication organization. 22V Research, LLC is not a securities broker-dealer, not a member of the Financial Industry Regulatory Authority (FINRA), not a registered investment advisor (RIA) and not a member of SIPC.

Securities transactions, when offered, are offered by 22V Securities, LLC through LPS Capital, LLC. Certain employees of 22V Securities, LLC are dually registered as securities representatives of LPS Capital, LLC or Analyst Hub Securities, LLC. 22V Securities, LPS Capital and Analyst Hub Securities are members FINRA, SIPC.

https://brokercheck.finra.org/

Current Ratings Definition.

SECTOR OUTPERFORM: An “outperform” rating anticipates the company will outperform the S&P Regional Banking Index (peer group).

SECTOR PERFORM: A “market perform” rating anticipates the company will perform in line with the S&P Regional Banking Index (peer group).

SECTOR UNDERPERFORM: An “underperform” rating anticipates the company will underperform the S&P Regional Banking Index (peer group).

Limitation Of Research And Information.

This Report has been prepared for distribution to only qualified institutional or professional clients of 22V Research Group. The contents of this Report represent the views, opinions, and analyses of its authors. The information contained herein does not constitute financial, legal, tax or any other advice. All third-party data presented herein were obtained from publicly available sources which are believed to be reliable; however, the Company makes no warranty, express or implied, concerning the accuracy or completeness of such information. In no event shall the Company be responsible or liable for the correctness of, or update to, any such material or for any damage or lost opportunities resulting from use of this data. Nothing contained in this Report or any distribution by the Company should be construed as any offer to sell, or any solicitation of an offer to buy, any security or investment. Any research or other material received should not be construed as individualized investment advice. Investment decisions should be made as part of an overall portfolio strategy and you should consult with a professional financial advisor, legal and tax advisor prior to making any investment decision. 22V Research Group shall not be liable for any direct or indirect, incidental or consequential loss or damage (including loss of profits, revenue or goodwill) arising from any investment decisions based on information or research obtained from 22V Research Group.

Reproduction And Distribution Strictly Prohibited.

No user of this Report may reproduce, modify, copy, distribute, sell, resell, transmit, transfer, license, assign or publish the Report itself or any information contained therein. Notwithstanding the foregoing, clients with access to working models are permitted to alter or modify the information contained therein, provided that it is solely for such client’s own use. This Report is not intended to be available or distributed for any purpose that would be deemed unlawful or otherwise prohibited by any local, state, national or international laws or regulations or would otherwise subject the Company to registration or regulation of any kind within such jurisdiction.

Copyrights, Trademarks, Intellectual Property.

22V Research Group, and any logos or marks included in this Report are proprietary materials. The use of such terms and logos and marks without the express written consent of 22V Research Group is strictly prohibited. The copyright in the pages or in the screens of the Report, and in the information and material therein, is proprietary material owned by 22V Research Group unless otherwise indicated. The unauthorized use of any material on this Report may violate numerous statutes, regulations and laws, including, but not limited to, copyright, trademark, trade secret or patent laws.
