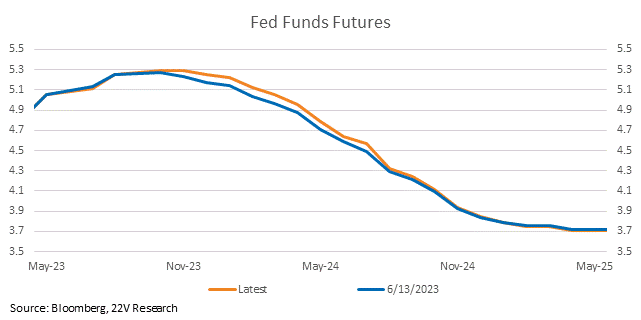
SUMMARY: The FOMC dot plot was more hawkish than expected, with two rate hikes guessed at rather than one (25bp signal was expected). But Powell largely downplayed the guesses during the presser and the market-based peak fed funds rate didn’t move. The back end of the Fed Funds futures curve did shift up some, reflecting higher odds the Fed keep the funds rate at 5% or above for longer, which is why UST yields are a bit higher today. If the question is “the extent rather than the existence of further tightening”, as Gerard put it (HERE), that should have some influence on financial conditions. The Fed does seem to have a higher core PCE forecast (3.9%) than most market participants and is still very much data-dependent. If core inflation continues to fall as forecasted and the economy holds up ok (the labor market doesn’t loosen too much), a large tightening of financial conditions and sharp selloff in stocks (5-10% or more) seems unlikely. Expect consolidation stocks near term, not a sharp sell-off.
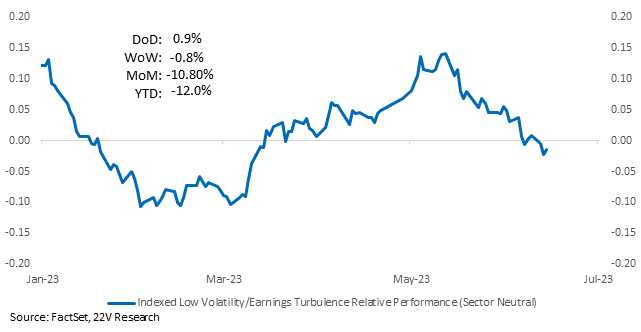
Yesterday’s internals were risk-off, but the move was not particularly large in magnitude and did not fully reverse the post-CPI risk-on rally. 2-day returns to Earnings Turbulence relative to Low Vol is +0.9%. We continue to expect Deep Cyclicals and “destocking losers” to rebound. Destocking losers have done well, deeper cyclicals not as well. Some China hope and a bit more hawkish Fed SHOULD help lift deeper cyclicals over the coming weeks.
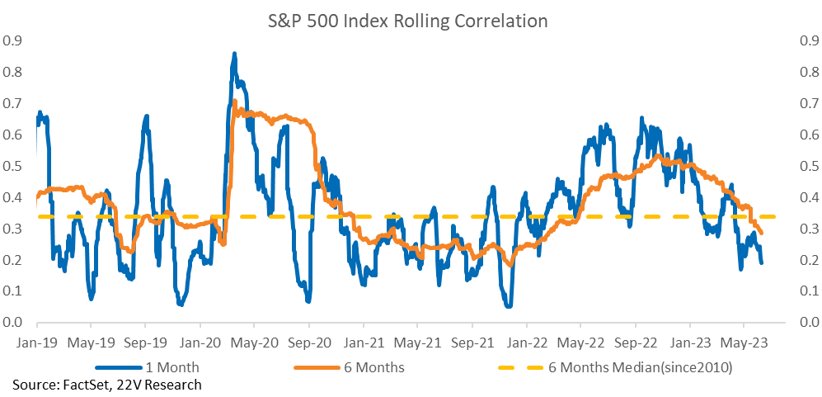
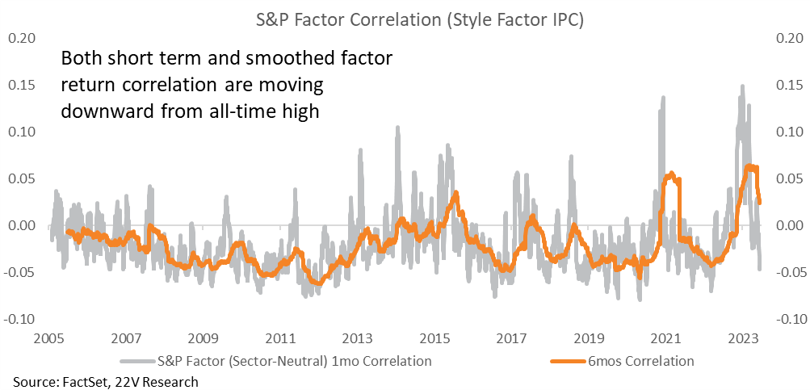
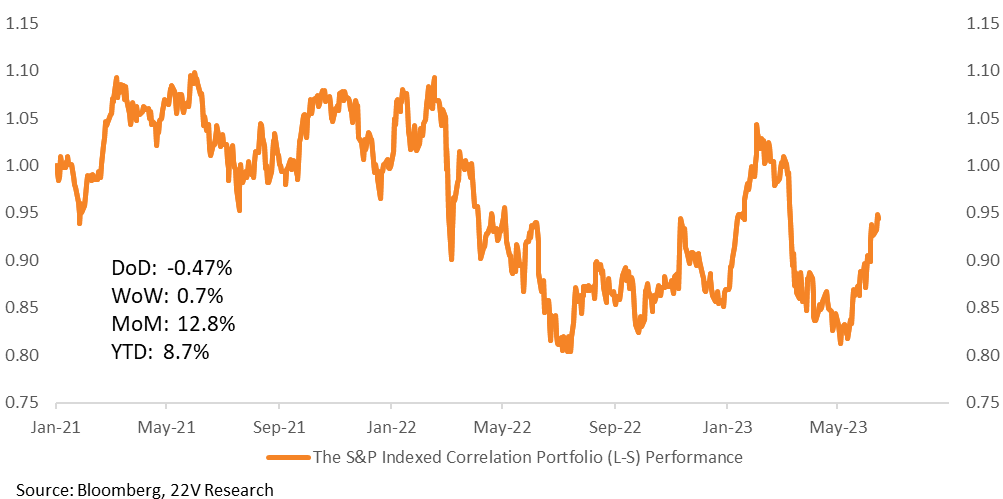
It is more important that single stock correlation is below its long-term median and factor return correlations are falling. Stocks and factors aren’t moving together, creating the opportunity for alpha via themes and single stock selection. If, as we expect, financial conditions don’t tighten significantly, correlations should remain low. Stocks that benefit from lower correlations are outperforming (basket below).
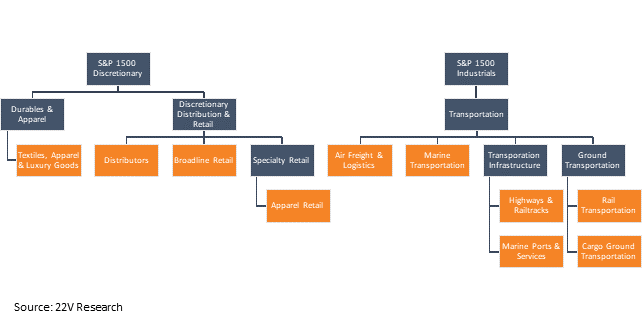
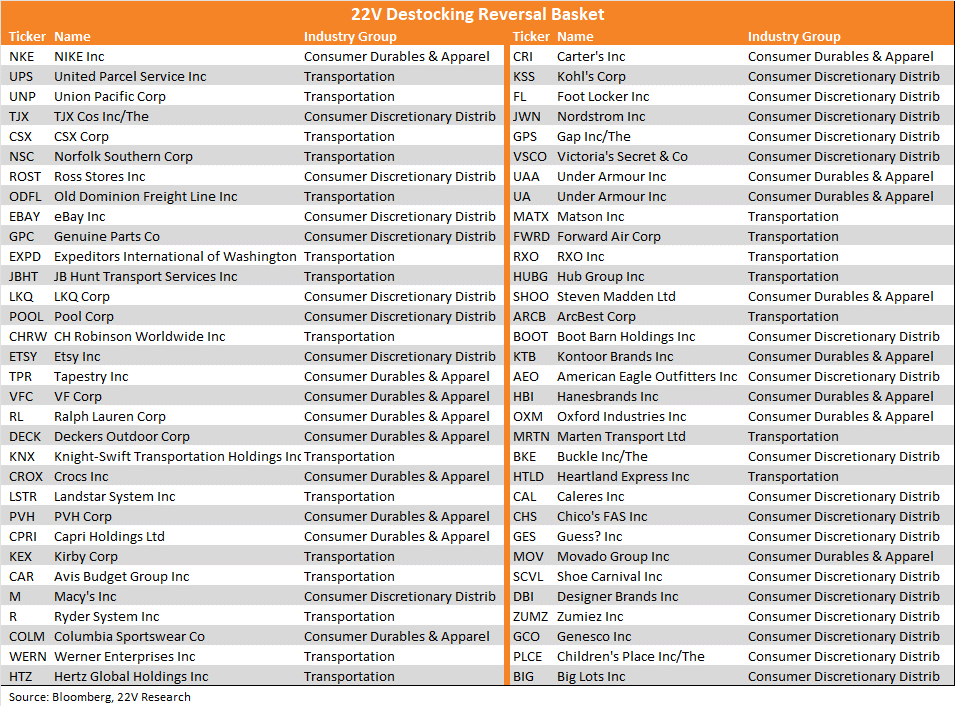
One of our favorite idiosyncratic themes is to be long the companies that were hit by inventory destocking. We created a basket to play inventory destock reversal, details and constituents of which are in the full report below.
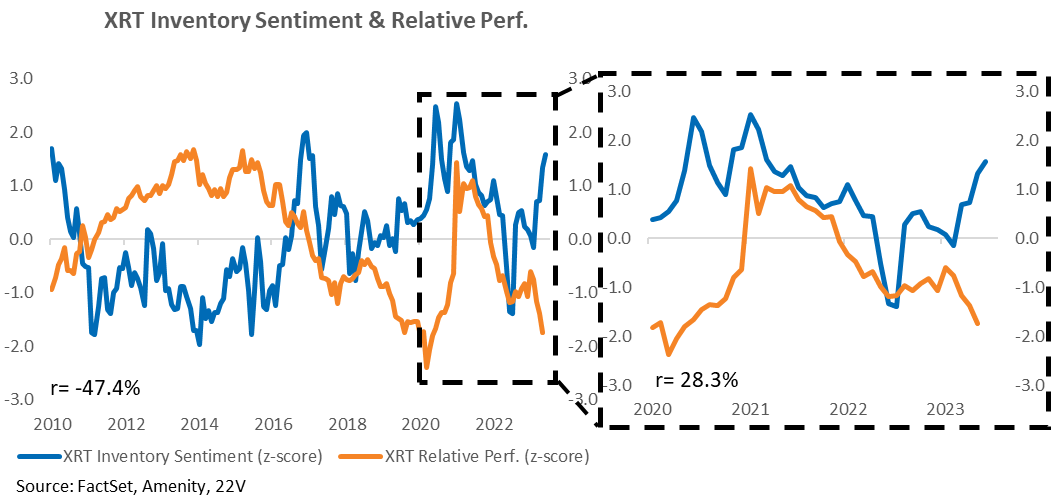
Our work on management sentiment, measured using the Amenity natural language processor, indicates an inflection point in destocking. Inventory sentiment within XRT, a retail ETF, has turned strongly positive. If we isolate the post-COVID period, when inventory concerns became a much bigger issue for companies, inventory sentiment and XRT relative returns have moved together. Management sentiment is an important signal and one not likely to be tracked/discounted to the same degree as traditional factors or more common alternative data.
Full report below…
MARKET VIEWS: The FOMC dot plot was hawkish, with two rate hikes guessed at rather than one. But the guesses were largely downplayed during Powell’s presser. The market-based peak fed funds rate didn’t move. The Fed is still data-dependent, not guiding. The labor needs to loosen further, and that’s still the risk to equities. But the soft-landing narrative can continue until the labor market loosening accelerates, as long as inflation continues to fall as forecasted. Below is the CORRECT fed funds futures curve. We sent the wrong one out yesterday.
Yesterday’s internals were risk-off, but the move was not particularly large in magnitude (Low Vol vs Earnings Turbulence had a 79th percentile return) and did not fully reverse the post-CPI risk-on rally. The 2-day return of Earnings Turbulence relative to Low Vol is +0.9%.
Basically, the current situation hasn’t changed. It is more important that single stock correlation is below its long-term median…

…and factor return correlations have dropped too. Stocks and factors aren’t moving together, creating the opportunity for alpha via idiosyncratic themes.
Our l-s correlation portfolio is outperforming.
Long Destock Reversal: One of our favorite idiosyncratic themes is long the companies that were hit by inventory destocking. For the inventory destocking reversal basket, we selected the S&P 1500 sub-industries that are the first and second-order effects from a destocking reversal – companies that sell economically sensitive goods (ex the interest rate-sensitive housing goods) and companies that ship those goods. Selected groups are highlighted below.
Our work with management sentiment, measured using the Amenity natural language processor, indicates an inflection point in destocking. Inventory sentiment within XRT, a retail ETF, has turned strongly positive. If we isolate the post-COVID period, when inventory concerns became a much bigger issue for companies, inventory sentiment and XRT relative performance moved together. Management sentiment is an important signal and one not likely to be tracked/discounted to the same degree as traditional factors or more common alternative data.
Macro data also backs up this view. Demand growth is below trend, but stable and positive. Real income growth has been kept positive via job gains even as wage growth has eased. At the same time, 1Q GDP data suggested inventories have probably over-corrected (HERE) and that likely continued in 2Q (see the ISM new orders, production, and inventory sub-components). The combination of better-than-expected economic growth and inventory over-corrections implies the destocking headwinds should fade.
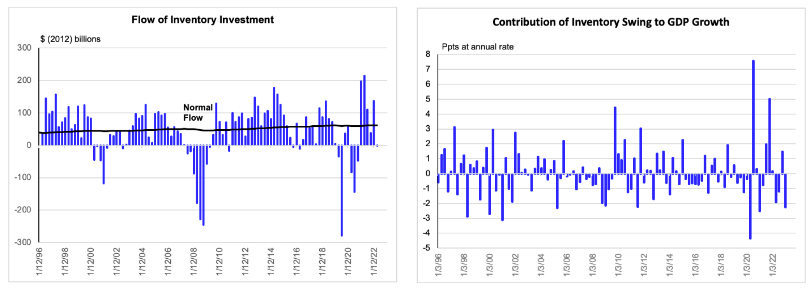
Source: BEA, FH calculations
Data are actual to Q1.
Basket here.
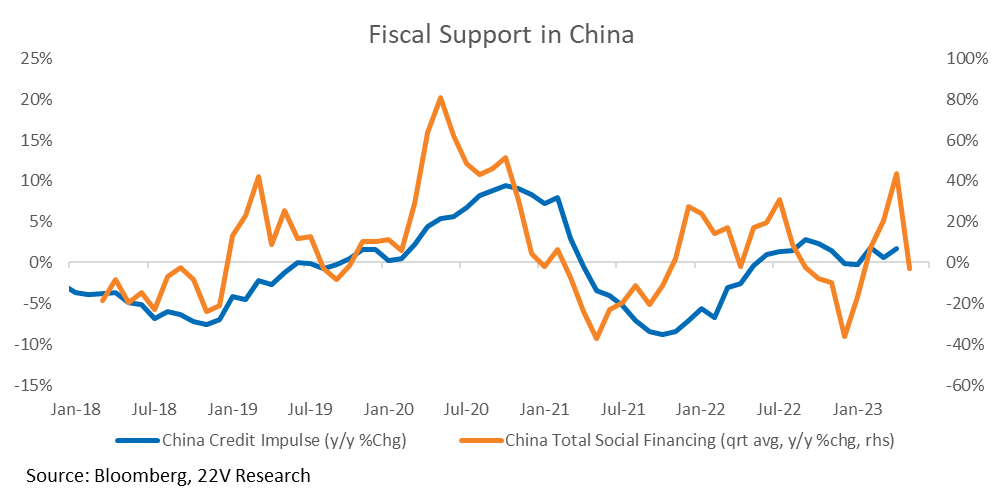
FYI on China Data: May data for China were quite weak and most areas missed analyst estimates. Michaels Hirson’s (22V’s head of China Strategy) initial take is that the May data were not bad enough to compel Beijing to give up discipline (such as major additional rate cuts, expanding the scale of investment and the fiscal deficit, trying to reflate property). The data were more mixed than in April, with IP steady and some bounce in goods spending. Michael continues to believe that Beijing will use mostly targeted measures in June/July to protect the bottom-line 5% growth target for this year.