

Friday’s release of the Financial Accounts for the first quarter confirmed a steep decline in the household sector’s reliance on credit in recent quarters. While this is by no means the only influence on the medium-term spending outlook, taken in isolation it suggests that consumer spending is not particularly fragile. As such, it is one consideration supporting a resumption of Fed tightening after the pause – or, perhaps more accurately, skip – to be delivered on Wednesday.
The 1-, 2- and 4-quarter growth rates of household sector debt are 2.2% (ar), 3.6%, and 5% respectively. So, there is a clear pattern of deceleration, which has allowed the simplest summary measure of leverage to imply resumed deleveraging. Looking forward, ongoing Fed tightening and a staggered repricing of household debt to current market rates would seem likely to stop or mute this deleveraging at some point. However, for now, it does point to a lack of financial fragility in the household sector.

Source: Federal Reserve, CBO, NBER, FH calculations
Credit data are actual to Q1, and CBO data are projected far forward.
Closely related, there has been a very steep deceleration of credit support to the flow of consumer spending, which I measure as the flow of consumer installment borrowing plus mortgage equity withdrawal (MEW). (In level, as opposed to the rate of change terms, the limited flow of credit is particularly impressive, given that inflation has remained well above normal.) This is convenient from a cyclical stability perspective, given that the effects of the ongoing tightening of bank credit would be amplified if the current flow of spending were heavily dependent on borrowing. Reductions in the supply of bank credit are contractionary. However, limited reliance on credit, as measured in the flow data, is a signal of stability. And it is worth keeping these two issues distinct, particularly in the current environment.
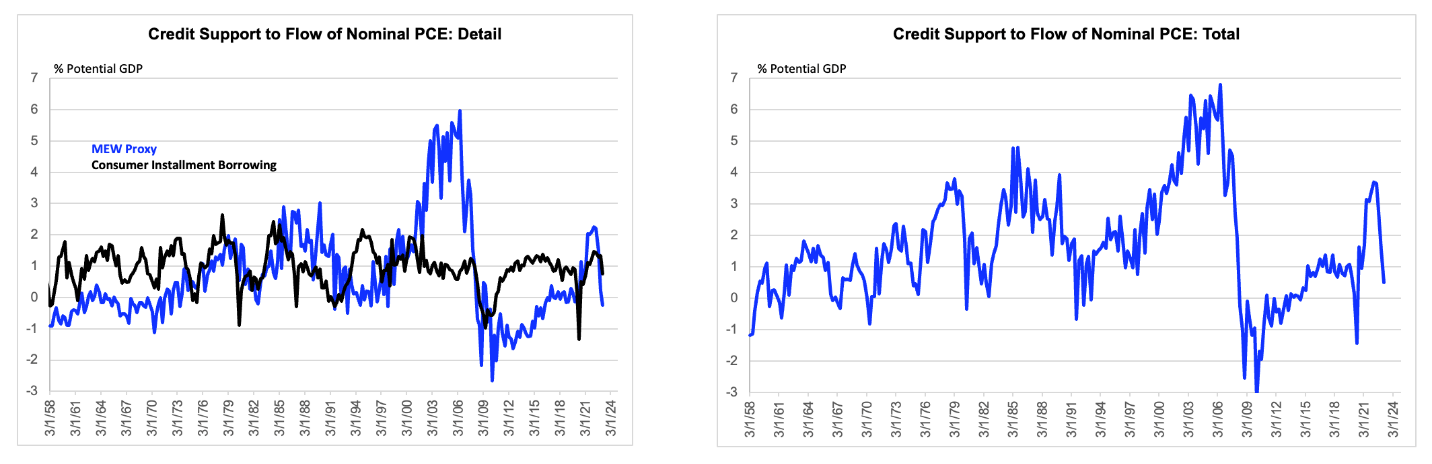
Source: Federal Reserve, CBO, NBER, FH calculations
Data are actual to Q1.
I am trying to avoid further belaboring my opposition to the Excess Savings Stock (ESS) thesis. But I would reiterate quickly that so-called excess savings, as conventionally measured, have played a very small role in the evolution of aggregate household wealth over the past few years and that the personal saving rate actually looks somewhat high relative to the wealth position of the household sector. I would not infer from this that the saving rate must fall from its recent level, which would provide an impetus to aggregate demand.[1] Rather, I would repeat a humbler claim. We should not reason from the reported level of the saving rate itself, especially today, where there is little to say about it.
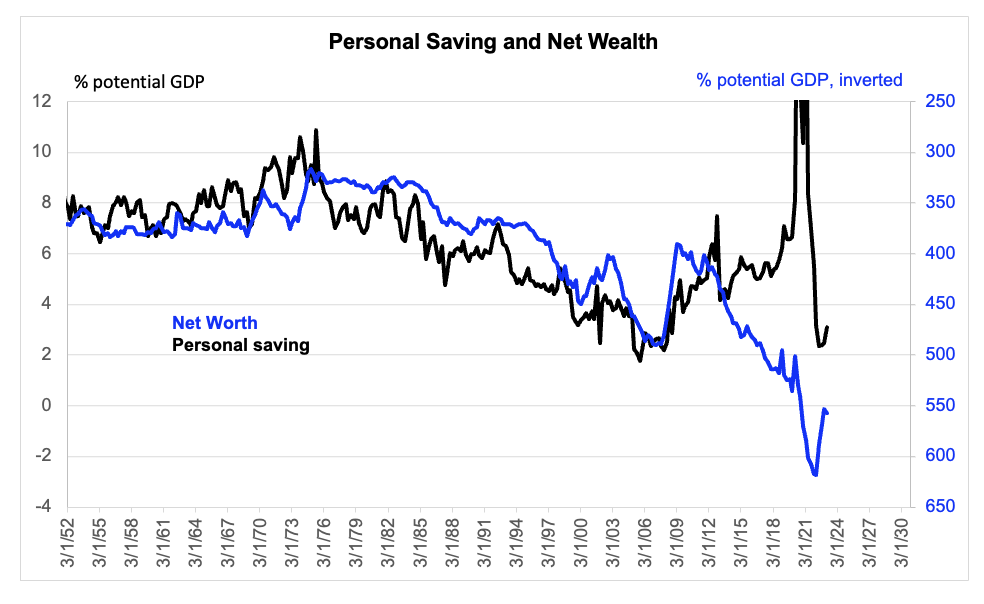
Source: Federal Reserve, BEA, CBO, FH calculations
Data are actual to Q1.
[1] It is possible that the personal saving rate is slightly overstated, relative to its own history, because higher inflation implies an erosion of real wealth held in nominal assets that the official saving rate does not capture. This issue has been helpfully pointed out by analysts at Applied Global Macro Research (AGMR) over the years. I have not replicated their quantification, but correcting for this issue would presumably make the saving rate appear less elevated.

