

With the focus on the then-upcoming jobs report, Thursday’s release of the Productivity and Cost revisions for Q1 did not get much attention, including from me. But there was a surprisingly large downward revision of unit labor cost inflation for the first quarter. ULC growth fell from an originally reported 6.3% (ar) to just 4.2%, against an expected revision to 6%. The 4-quarter change was revised sharply as well, from 5.8% in the old data to 3.8% in the new, with all of that revision due to the most recent two quarters. So, this is a pretty big deal.
However, as often these days, there is a caveat. The main source of the downward revision to unit labor costs was a downward revision of average hourly compensation, as the headline productivity data were not revised much. Meanwhile, there was very little revision to hours worked, which means that all of the decline of average hourly compensation was due to lower nominal labor income growth. And this is important because labor income is a component of Gross Domestic Income and thus has an influence on Gross Domestic Output, which is the average of GDI and GDP and meant to be a more reliable measure of aggregate economic activity. In principle, the productivity and cost figures should incorporate actual aggregate economic activity, rather than their imperfect image in the GDP detail.
It does not follow from this that downward revisions of average hourly compensation should have no effect on our sense of unit labor cost growth. That would be bizarre denialism, even by Wall Street macro research standards. It is just a matter of getting the quantification as right as possible. The passthrough from lower AHC to lower “true” ULC is less than one for one, for the reason mentioned above. And separately, weakness in the economy-wide profit figures reinforces the gap between GDP and GDI – and thus GDO. Accordingly, during the first quarter, the GDI grew 3.7 percentage points (ar) less quickly than GDP. Moreover, the majority of this gap would presumably show up in the nonfarm business sector where it would be proportionately larger. (I model all of it showing up there.)

Data are actual to Q1.
It is probably headache inducing to follow the accounting argument above and I mention it only to retain credibility among clients who read most critically. Most of you can just trust me to process this data in the usual way without bias or any effort to snow anyone. I may be wrong, but I am trying to be right and the adjustments I make are stable over time. And that brings us to the chart above, particularly the lower panel. The chart shows the usual metrics from the productivity and cost report but adjusted for the gap between GDP and GDI (and its neutral mapping into the productivity and cost data).
During the two quarters to Q1, adjusted unit labor costs rose at an annualized rate of 4.2%. The 4-quarter growth rate there is 5.6%. So, the pattern is a decelerating one and much more so than was evident on the old data. In fact, on the old data there was still an acceleration, evident particularly after the first look at GDI just over a week ago. This matters. But it leaves intact the idea that embedded inflation remains quite high and the Fed has work to do. I emphasize this because some of the folks who follow the notion of embedded inflation may be sounding a premature all clear. For example, consider this from Paul Krugman, who admittedly has a dove bias. Relatedly, I don’t think the BLS is “messing with our heads.” The data are complicated as ever, and the signal in Friday’s job report was a bit obscure. But it is not as if the signals are unusually contradictory, more just mixed.
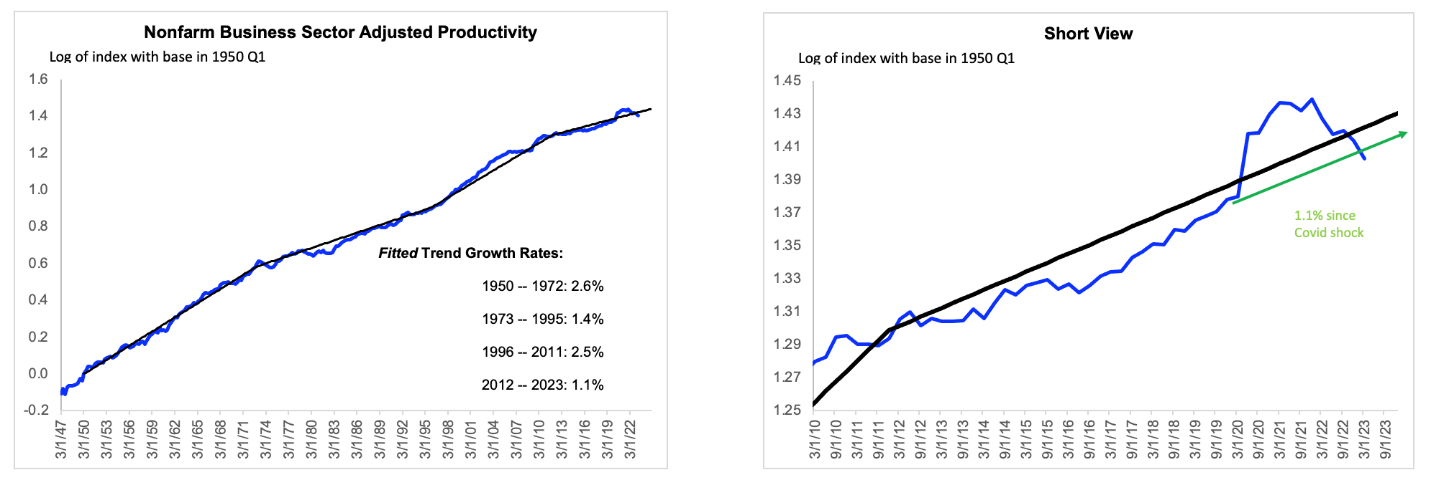
I will conclude with a brief comment on the productivity data to Q1 and then their prospect for Q2. I will focus on the “adjusted” productivity figures to avoid having too many concepts on the go here. Adjusted productivity is down 4.4% (ar) in Q1 and 2.4% vs four quarters ago. If we look at it in level terms vs what we might take to be the recent trends, as in the chart below, we see that productivity has broken below the admittedly arbitrary trendline, of 1.1%, I trace back to 2012. And it has grown less quickly than 1.1% over the Covid period as well. (I make this distinction because it was below trend immediately pre-Covid as well.)
Looking into Q2, the early data suggests a mild revival of productivity, simply because it looks like the index of aggregate hours worked produced in the jobs report is on track to be flat, on average, during Q2. So, if output were to rise, as is consensus, that would show up in positive productivity growth. But it is a bit early in the process to mention even a rough estimate.
Data are actual to Q1.

