SUMMARY: Yesterday saw a 98th %tile DoD move in Cyclicals relative to Defensives. Earnings Turbulence had a similar move relative to Low Volatility stocks. Today we look at what is going on. The main point is since the banking crisis started market internals were strongly risk-off. Consistent with our surveys of investor positioning and recession risk (HERE), there seemed two popular narratives. The first was the economy would slow quickly from March forward, keeping downward pressure on inflation and the possibility of a recession being avoided. The second narrative was that a recession would begin soon, so positioning for lower inflation would work even better. Win Win for risk-off.
The problem with both narratives, near term, is bank lending and liquidity sentiment data ARE NOT confirming fears about credit tightening (HERE) and the economic data has consistently beat expectations. After a firm 1Q GDP report, which was held back by inventories, the Atlanta Fed’s GDPNow is forecasting 2.9% GDP growth in 2Q. That is WELL above the pre-COVID trend. For now, economic trends do not support heightened near-term recession risk. Some mean reversion in risk-on factors should be expected.
A point on economic growth and financial conditions that needs to be internalized and relates to why the growth has been resilient. This fits with our view that most of the impact from the tightening of financial conditions has been felt. As Gerard re-highlighted yesterday (HERE), “the effect of Fed tightening on real activity operates primarily through the interest-sensitive sectors of the economy, including most prominently residential investment, with knock-ons to durable goods demand. During the final three quarters of last year, very steeply declining residential investment directly reduced aggregate demand growth by an average of 120 bps (ar).* During the first quarter of this year, that drag fell to just 20 basis points. And the odds seem heavily stacked against a resumed drag here, at least without a repricing of the Fed path and a rise of mortgage yields associated with that.” In short, don’t expect the economy to fall into a recession unless the Fed tightens more. People have not internalized this point.
Of course, the risk is the Fed having to tighten more. Either by raising the funds rate or keeping it higher for longer as the economy slows. Our call is that the economy will slow more and that recession risk is 50/50 6mos forward. That is based on wages staying too high as the economy cools, requiring persistently restrictive policy. The Fed is on hold for now though, which means FCI shouldn’t move much and that will keep PEs range bound.

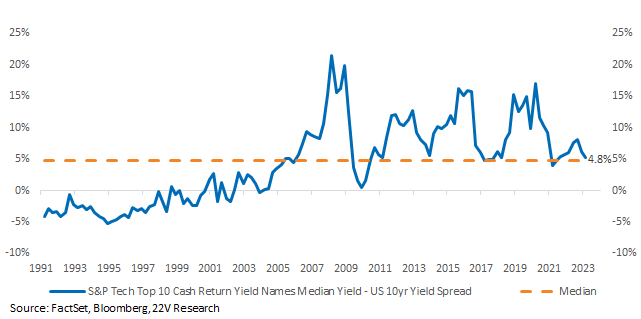
Last points: John Roque has some charts on Healthcare and Utlility weakness that we highlight and we cover why mega caps have held up so well. The top 10 Tech stocks have a +4.8% cash return yield spread vs 10yr yields. That is very important to the asset allocation community.
Full report below…
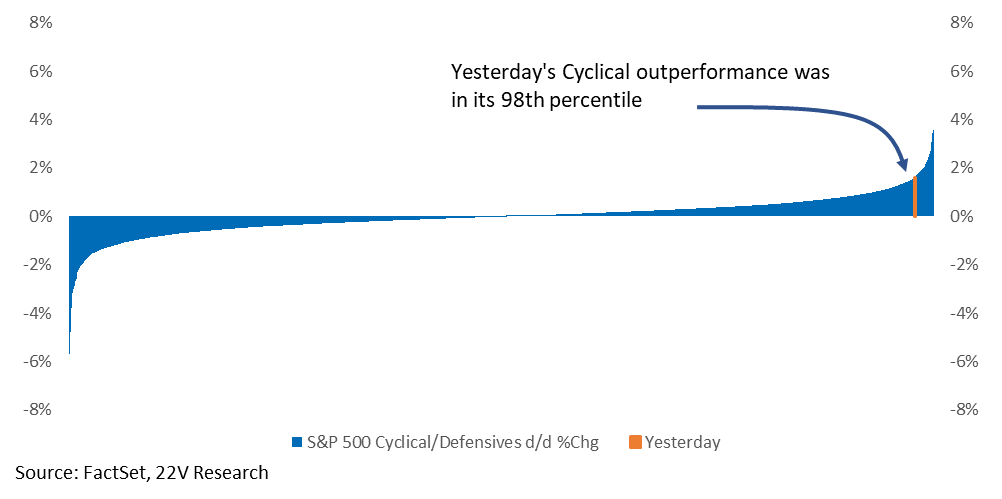
MARKET VIEWS: Economic data have been consistently stronger than expected and combined with better than expected inflation readings, some mean reversion in risk-on factors and Cyclicals should be expected. That finally showed up yesterday as Cyclicals had a 98th%tile DoD outperformance vs Defensives. Recall, stocks that benefit from lower inflation and interest rates had significantly outperformed since the banking crisis started in March.
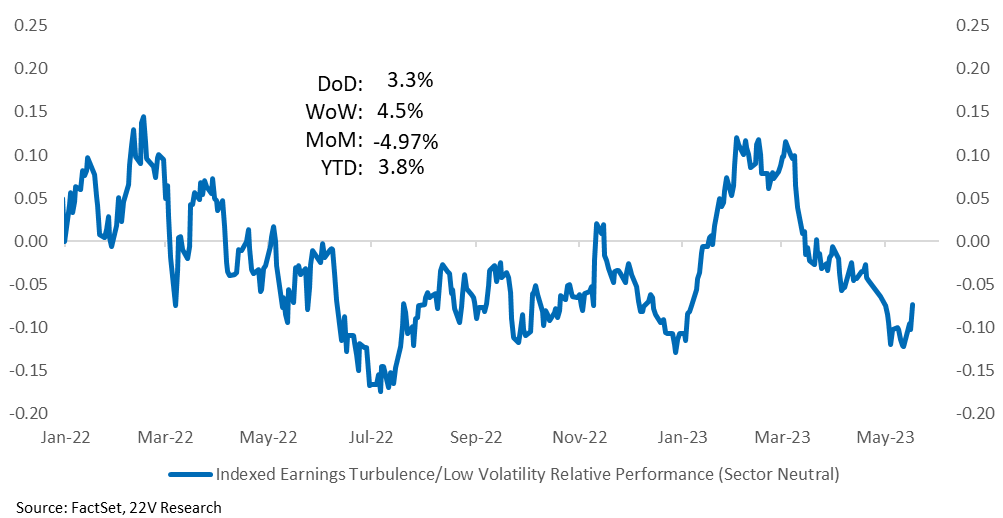
We wouldn’t say a recession was priced starting in March (credit spreads remained range bound, along with inflation expectations), but the choices seemed to be 1) an economy slowing quickly after March that kept downward pressure on inflation and where a recession MIGHT be avoided, or 2) a rapid decline into recession (which 81% of investors thought would be the case according to our survey HERE). Both narratives encouraged positioning for lower inflation. Win-Win. Lower than expected core services CPI and wage growth reinforced the lower inflation idea. That helps explain the 97th %tile decline in Earnings Turbulence Relative to the Low Vol starting in March.
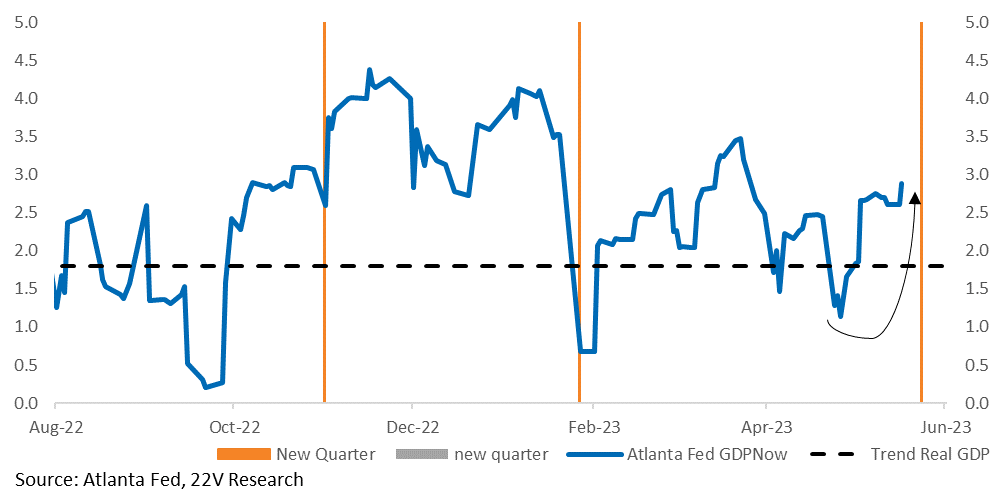
The problem with the above views is that bank lending and deposit data HAVE NOT confirmed the worst fears about a tightening of lending standards (HERE), and the economic data have been consistently better than feared. Strong wealth effects and income growth continue to support spending. Also, after a firm 1Q GDP report, which was held back by inventories, the Atlanta Fed’s GDPNow is forecasting 2.9% GDP growth in 2Q. That is well above the pre-COVID trend. For now, economic trends do not support heightened near-term recession risk.
As Gerard re-highlighted yesterday (HERE), “the effect of Fed tightening on real activity operates primarily through the interest-sensitive sectors of the economy, including most prominently residential investment, with knock-ons to durable goods demand. And this is important because during the final three quarters of last year, very steeply declining residential investment directly reduced aggregate demand growth by an average of 120 bps (ar).* During the first quarter of this year, that drag fell to just 20 basis points. And the odds seem heavily stacked against a resumed drag here, at least without a repricing of the Fed path and a rise of mortgage yields associated with that.” In short, the economy should not fall into a recession unless the Fed tightens more FROM HERE. People have not internalized this point. Below are financial conditions relative to demand growth. As measured by the NY Fed Weekly Economic index.
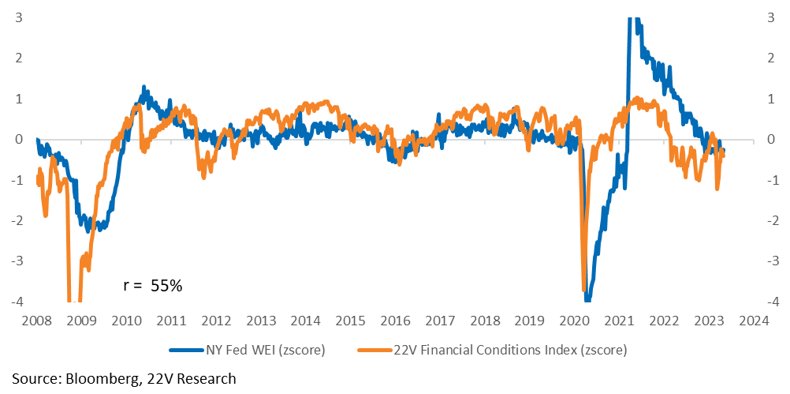
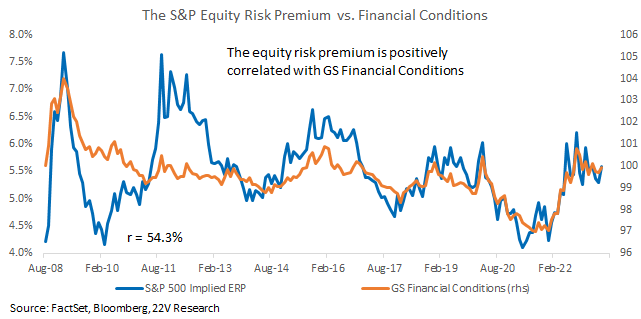
For now, the Fed is signaling a pause, which is why financial conditions have been range bound, keeping the equity risk premium and PEs from moving much. If demand growth or wage growth remains too firm and the Fed has to signal more hikes to further slow interest-sensitive areas of the economy, equities will come under pressure.
What Is Going On With Mega Caps: We have been asked about mega caps seemingly bullet proof outperformance. Keep in mind the asset allocation forces that support the gains of high cash-returning large tech stocks. The current spread between the top ten Tech stocks cash return yields and 10yr yields is 4.8% in the mega caps favor. They are still near monopolies with an unusually high cash return yield vs credit. Asset allocators still find that attractive. Especially if they believe inflation is headed lower. If 10yr yields move significantly higher or cash returns decline significantly (which could happen in a proper recession), Mega caps will be at risk.
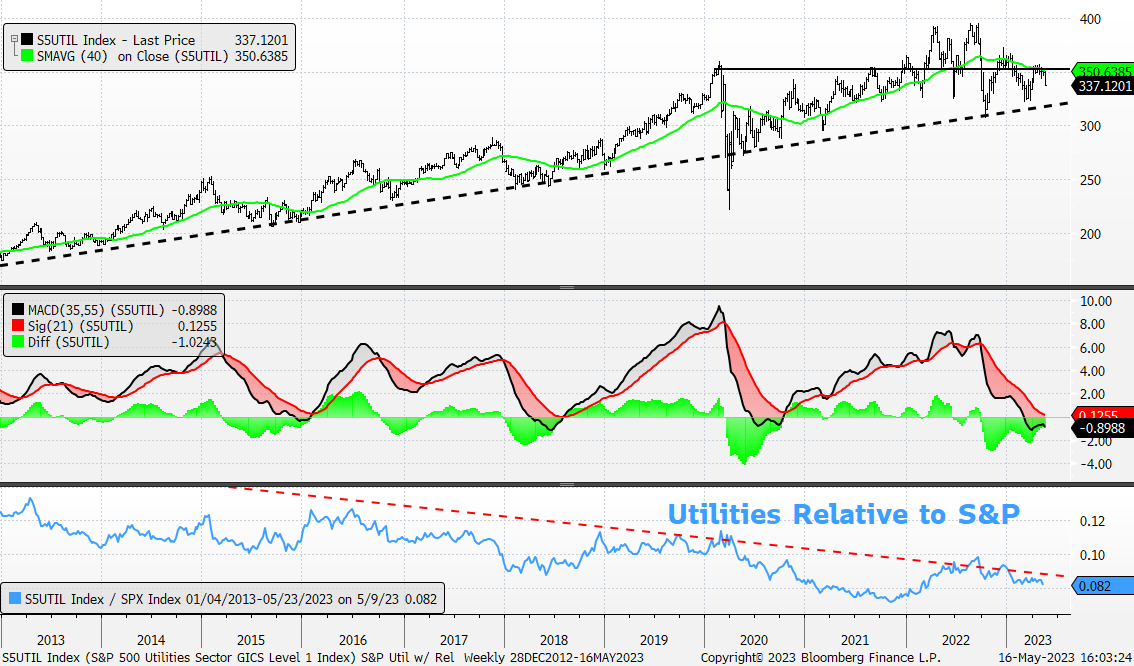
John Roque Had Some Charts on Utilities and HC. Wanted to Pass Along – S&P Utility Sector: Weekly w/ 40-Wk MA, MACD, and Rel to S&P: Negatives include a Technical Score = 0, below downward-sloping 40-Wk MA, negative weekly mo, and bearish vs. S&P. (You can substitute the Utilities Select Sector SPDR Fund for the S5UTIL below)
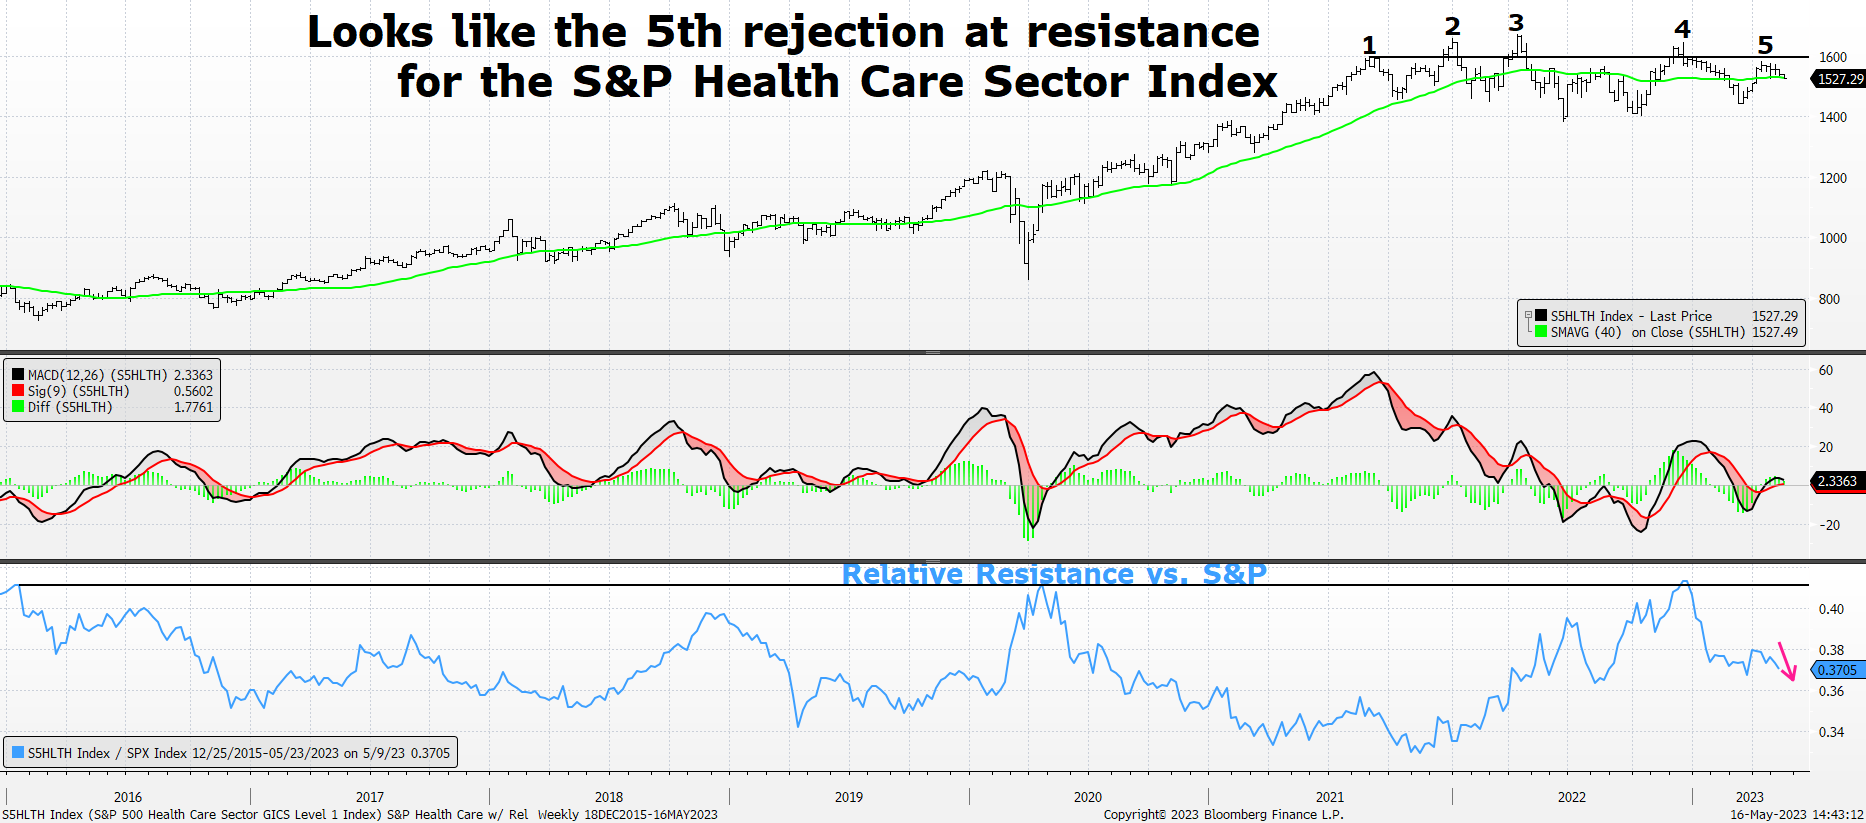
S&P Health Care Sector Index (S5HLTH) and the comparable ETF is the XLV: Rejected for the 5th time at resistance. Close to moving below its cresting 40-Week Moving Average. Punky momentum. Weakening, again, relative strength vs. S&P 500.